Reconception des systèmes de services fondée sur la satisfaction des employés, la satisfaction des clients et la productivité du travail
- Type de publication : Article de revue
- Revue : European Review of Service Economics and Management Revue européenne d’économie et management des services
2020 – 2, n° 10. varia - Auteurs : Takenaka (Takeshi), Nishikoori (Hiroshi), Nishino (Nariaki), Watanabe (Kentaro)
- Pages : 17 à 47
- Revue : Revue Européenne d’Économie et Management des Services
Re-design of service systems based on employee satisfaction, customer satisfaction and labour productivity
Takeshi Takenakaa,
Hiroshi Nishikoorib,
Nariaki Nishinoc,
Kentaro Watanabea
aNational Institute of Advanced Industrial Science and Technology (AIST)
bMS & Consulting, Co. Ltd,
cThe University of Tokyo
Introduction
Improved productivity of the service sector, which employs many workers and which accounts for a great part of GDP, has been a crucially important objective for over a decade in many mature economies undergoing rapid change in economic structures. Earlier studies of Japan have revealed lower labour productivity and lower total factor productivity of the service sector than those of other countries such as the United States (Morikawa, 2007). Additionally, some service sector difficulties, such as lower investment in information and technology (Fukao, 2015) and long working hours (Morikawa, 2010), have been indicated as factors contributing to low productivity. Based on results of those earlier economic studies, the Japanese government has cast productivity improvement of service sectors as the most important issue from the mid-2000s to the 18present. Nevertheless, it remains difficult for service industries to adopt or even identify the most effective modes of operation for their businesses.
Productivity improvement is often discussed as a positive change in output (value or profit) per unit of input (cost and labour). Roughly speaking, along with growth of chain-store operation systems, the scale of retail and restaurant companies has developed in the 1970s and 1980s in developed countries. High productivity was achieved through improvement of input efficiency based on scale merits. Additionally, well-standardized and efficient service provision systems and low prices for customers have been sources of competitiveness. However, in subsequent decades, severe worldwide price competition depressed company profitability. What is worse, such competition often depressed labour productivity and quality of services. Specifically in the case of Japan, restaurant industries have been adversely affected during this decade by severe labour shortages. It has become increasingly difficult to maintain service quality. Moreover, workers of younger generations tend to dislike working for service industries such as the restaurant industry because of their bad reputations of job conditions and high employee turnover rates. Accordingly, major Japanese restaurant chains have recently become interested in introducing new technologies including robotics, food-processing machines, or self-check-out systems to maintain their levels of service with fewer employees. Although automation might be desirable for jobs that should not necessarily be done by humans, employee skills and motivation to work are expected to constitute the basis of high service quality and high customer satisfaction. Additionally, increasing costs of labour and natural resources compel restaurant companies to shift to high-value-added business models. Therefore, strategies of service productivity improvement should be reconsidered from pursuing efficiency to enhancing the value of services provided by employees. Nevertheless, it is often difficult for service companies to predict how a change in the business model will affect customer and employee satisfaction and how productivity will be changed.
Given that background, we have tackled various difficulties related to service productivity improvement to support service industries from a service engineering viewpoint. Service engineering, an inter-disciplinary research field developed especially in Japan from the early 2000s, aims to realize service ecosystems to create value (Watanabe et al., 2016; 19Watanabe, Mochimaru, 2017; Ueda et al., 2017) through observation, analysis, design, and application of services. Analysis of service systems using quantitative and computational approaches is done widely in service engineering. Service value should be evaluated in terms of social aspects and multiple perspectives such as customer satisfaction, employee satisfaction, efficiency, and profitability (Takenaka, Nishino, 2017).
Figure 1 presents value aspects from important stakeholders (customer, employee, company (management) and society) and their representative key performance indicators. Although this figure might be an oversimplification, this representation has often been examined in service studies exploring the services triangle or the service marketing triangle (Kotler, 1994, 2008). Moreover, the service–profit chain proposed by Heskett et al. (1997, 2008) is a well-known model showing that increased employee satisfaction (ES) positively affects consumer satisfaction (CS), and eventually improves company profitability. Many researchers have tried to verify the service–profit chain theory using quantitative data (Chi, Gursoy, 2009; Hogreve et al., 2017). In addition, the value of services should be evaluated from the perspective of sustainable development goals (SDGs) such as gender equality (goal 5), decent work, economic growth (goal 8) and responsible consumption and production (goal 12) (World Health Organization, 2015). Recently, many companies have begun to realize that addressing SDGs can be expected to improve customer and employee engagement.
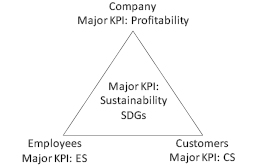
Fig. 1 – Services triangle and representative key performance indicators (KPI).
20Nevertheless, establishing common and standardized numerical indicators to evaluate various aspects of services is often difficult. Additionally, building a computational model based on analysis of relationships among different indicators requires collection of data on a large scale across companies or industries. For this purpose, we have developed indicators of CS and ES in collaboration with a research company.
Given that background, this paper presents efforts at standardizing ES and CS indicators. Results of analyses of company performance using those indicators and management indexes are presented. Then, a theoretical service model is constructed from a game theoretic viewpoint considering employee, customer and company players. Finally, simulation results are shown. They illustrate the effects of human resource strategies considering the pay structure for service management.
1. Development of standardized
evaluation indicators for services
Through more than four years of collaboration in a research project involving MS & Consulting Co. Ltd. and the National institute of Advanced Industrial Science and Technology (AIST), we have strived to develop a standardized survey method of ES and CS and evaluation criteria. The former is a major marketing consulting firm in Japan, conducting over 200,000 mystery shopper research cases per year. In all, they have conducted over 1 million employee satisfaction surveys. Mystery shopper programs and employee satisfaction surveys are usually customized according to client needs. However, they have also designed some questions for evaluating performance among different companies in the same business categories or among different service industries. Through research collaboration with AIST, MS & Consulting Co. Ltd. have developed common and standardized methods of CS and ES surveys. This paper introduces those survey methods along with some examples of analyses conducted for ES and CS using those indicators.
Another important indicator to evaluate services is profitability or productivity from a management viewpoint. We have collected 21management data such as sales, profitability, labour cost, and labour productivity, along with further collaboration with restaurant and retail companies. Using those data, we have also examined relations among ES, CS, and profitability. Nevertheless, it is often difficult to compare those management indicators among companies with different business models. This paper presents a case of a Japanese apparel company that shows a positive relation between the ES level of apparel shops and year-on-year sales (Nishikoori et al., 2018).
1.1. Employee satisfaction survey
and standardized indicators
This section introduces the ES survey method, based on earlier studies (Nishikoori et al., 2018), which we developed using data of 96,600 employees. Questionnaire items for ES surveys were designed originally by MS & Consulting Co. Ltd. based on some earlier studies of employees’ job satisfaction, including “servant leadership theory” originally proposed by Greenleaf (Greenleaf, 2002; Parris, Peachey, 2013), Herzberg’s two-factor theory of work motivation (Herzberg et al.,1959), and psychological ownership theories (Heskett, 2008). They used about 45 questionnaire items as common items with some items added depending on the survey. However, it was necessary to reconstruct questionnaire items to standardize ES survey methods from statistical viewpoints and from universality of questionnaire items. Although ES survey methods of many types exist, they sometimes ask about different aspects of employee satisfaction. For example, in a single survey, employees might evaluate their satisfaction on different aspects such as satisfaction with leaders, teamwork, team members, job conditions, or the perceived worth of their own jobs. Therefore, authors have tested questionnaire items statistically based on a psychological scale development method. Through trial-and-error adjustment, we reduced the number of questionnaire items so that they could be categorized into some important and different categories with good universality. At present, we use 36 questionnaire items as common questions. For this method, we categorized questions into two groups in advance related to the satisfaction with the work environment and satisfaction with work itself (Tables 1 and 2). Then those questions were categorized into five groups related to Leadership, Team hospitality, Team capability, Job autonomy, and Job Satisfaction.
22Tab. 1 – Results of factor analysis using questions for work environment evaluation: n = 96 600, 128 companies, factorization (ML, Kaiser, Promax).
|
Factor |
Questions |
Factor 1 |
Factor 2 |
Factor 3 |
α |
|
Factor 1 (Leadership) |
Trust |
0.907 |
0 |
-0.072 |
0.945 |
|
Clear vision |
0.853 |
-0.051 |
0.03 |
||
|
Empathy for vision |
0.833 |
0.009 |
-0.015 |
||
|
Effective advice |
0.833 |
0.032 |
-0.043 |
||
|
Consistency of words and action |
0.823 |
-0.051 |
0.052 |
||
|
Careful listening |
0.794 |
0.064 |
-0.083 |
||
|
Clear plans |
0.786 |
-0.048 |
0.102 |
||
|
Interest in members |
0.71 |
0.116 |
-0.067 |
||
|
Communication |
0.662 |
-0.051 |
0.15 |
||
|
Factor 2 (Team hospitality) |
Mutual care for co-workers |
-0.069 |
0.963 |
-0.15 |
0.872 |
|
Awareness of co-workers’ growth |
-0.064 |
0.738 |
0.14 |
||
|
Hospitality for customers |
-0.043 |
0.719 |
0.071 |
||
|
Personal relationships |
0.116 |
0.671 |
-0.073 |
||
|
Sharing vision |
0.145 |
0.514 |
0.21 |
||
|
Factor 3 (Team capability) |
Capability of performance |
-0.051 |
-0.01 |
0.896 |
0.879 |
|
Ability to accomplish |
-0.062 |
0.003 |
0.889 |
||
|
Proactive expression |
0.12 |
0.267 |
0.399 |
||
|
Benchmarking |
0.186 |
0.162 |
0.393 |
||
|
Frequency of meetings |
0.219 |
0.077 |
0.375 |
||
|
Environment to enhance good points |
0.172 |
0.304 |
0.322 |
Tab. 2 – Results of factor analysis using questions for job satisfaction evaluation: n = 96 600, 128 companies, factorization (ML, Kaiser, Promax).
|
Factor |
Factor 1 |
Factor 2 |
α |
|
|
Factor 1 (Job satisfaction) |
Working is worthwhile |
0.839 |
0.036 |
0.906 |
|
Sense of belonging |
0.807 |
-0.08 |
||
|
Intention of recommendation |
0.737 |
-0.029 |
||
|
Physical and mental health |
0.725 |
-0.073 |
||
|
Sense of achievement |
0.648 |
0.181 |
||
|
Appropriate assessment |
0.506 |
0.166 |
||
|
Sense of growth |
0.438 |
0.34 |
||
|
Pride in one’s own job |
0.424 |
0.408 |
||
|
Motivation for improvement |
0.389 |
0.255 |
||
|
Factor 2 (Job autonomy) |
Sense of influence |
-0.035 |
0.78 |
0.853 |
|
Sense of meaningfulness |
0.046 |
0.743 |
||
|
Sense of responsibility |
0.035 |
0.71 |
||
|
Sense of decision-making |
0 |
0.649 |
||
|
Proposals for improvement |
-0.052 |
0.533 |
||
|
Sense of customer satisfaction |
0.188 |
0.53 |
||
|
Clear division of roles |
0.106 |
0.495 |
Figure 2 shows normalized scores (Z score) of Bartlett scores of five factors according to some business categories. The score is calculated using 96 600 employee data. Comparison among industries reveals overall tendencies in ES indicators. In this case, restaurant-chain companies, for example, have high scores in all five aspects of ES. Actually, this result was helpful for the Japanese restaurant industry group, which had been concerned about unwarranted rumours related to working conditions. We were specifically concerned about low ES levels of drugstores, supermarkets, hair salons, and business hotels because those industries were fundamentally appreciated by consumers in Japan for convenience. Although details are not presented herein, the results of mystery shopper programs for the same companies of retail companies sometimes show high CS levels. Those gaps between higher CS and lower ES might reflect long-term instability of service systems.
24
Fig. 2 – Employee satisfaction with service industries
shown by number of employees.
1.2. Customer satisfaction indicators acquired
through mystery shopper programs
Customer satisfaction has been investigated intensively in consumer and marketing studies (Hennig-Thurau, Klee, 1997). Some indicators are already used as standards in many countries. The Swedish Customer Satisfaction barometer, for example, is the first common indicator to measure more than 30 industries in Sweden (Fornell, 1992). The American Customer Satisfaction Index might be the most well-known index (Fornell, 1996). The method has been applied to many countries for large-scale surveys of customer satisfaction, even in Asian countries such as Japan, Korea and Singapore. Although the definition and relation between satisfaction and loyalty still presents difficulties (Dick and Basu, 1994), some key questionnaire items are commonly used to evaluate customer loyalty. For example, intentions for repeat purchase or intentions of recommendation to others are widely used indexes that represent customer loyalty to services.
25Apart from questionnaire survey methods of customer satisfaction targeting general consumers, mystery shopping (or mystery shopper programs) has also become popular in marketing research to assess service quality and some aspects of customer satisfaction (Wilson, 2001). In Japan, mystery shopper programs are popular as marketing research to improve service quality in many service industries including restaurants, retail outlets, beauty salons, amusement parks, and gas stations. By mystery shopping, well-trained mystery guests visit a shop and report details of services using a pre-designed checklist that includes required items to keep service qualities that the company specified. Additionally, mystery guests are often asked about their satisfaction using some questionnaire items including satisfaction with food quality, atmosphere, hospitality, price and intention of a repeat purchase or recommendation to others.
As described above, MS & Consulting Co. Ltd. conducts over 200,000 mystery shopper research cases per year in Japan. We have strived to standardize CS and have calculated the average and standard deviation of results for all results of mystery shopping. Through those efforts to normalize scores of CS using some different indicators, one can compare performance among different shops of a single company or among companies in the same industry.
Figure 3 presents an example comparing performances of three restaurant companies of CS using mystery shopping. The mystery shopping surveys are conducted 69, 342, and 77 times, respectively, for the shops of restaurant companies A, B, and C. The averaged scores were used to denote companies’ performance. The Z score is calculated using all mystery shopping results on restaurants for a certain period. Through such comparisons, companies were able to ascertain their strong and weak points in business.
26
Fig. 3 – Comparison of CS using Z scores for three restaurant stores.
1.3. Relation between CS and ES
Some companies that have conducted mystery shopping surveys also conduct ES surveys for their employees. Table 3 shows relations between CS and ES for 48 restaurant companies from October 2016 through September 2017. Although the numbers of mystery shopping surveys and employee satisfaction surveys vary among companies, an average of 832 employees were surveyed for employee satisfaction and 588 mystery shopping surveys were conducted for each company. Table 3 shows some CS items that are correlated significantly with ES factors. Especially, “Job autonomy” correlates significantly with three CS items: “Intention to recommend”, “Satisfaction with food”, and “Satisfaction with hospitality”. This result suggests that autonomous and confident employees could enhance CS. This also supports the service-profit chain theory (Heskett, 2008). Furthermore, “Satisfaction with hospitality” correlates with three factors: “Job satisfaction”, “Team hospitality”, and “Job autonomy”. Especially, “Job satisfaction” which is strongly related to employee loyalty to the company as shown in Table 2 could be enhanced by CS. These results suggest not only that high ES enhances CS, but also that high CS enhances ES. Based on those findings, we propose a theoretical service model constructed from a game theoretic viewpoint, in which an employee player can acquire some sort of satisfaction from CS in addition to salary as described in the next section.
27Figure 4 shows a plot of the normalized score of Job satisfaction (ES) and Satisfaction with hospitality by company (CS). Overall, significant correlation was found between these two indicators, as shown in Table 3, but some outliers are also observed. Results might show that ES is not connected to CS and vice versa. Through such analyses, individual companies can also learn about their service models.
Tab. 3 – Correlation coefficient matrix showing ES and CS
in 48 restaurant companies (*, p<0.05; **, p<0.01).
|
Leadership |
Team capability |
Team hospitality |
Job autonomy |
Job satisfaction |
|
|
Intention to repeat |
0.26 |
0.06 |
0.27 |
0.28 |
0.22 |
|
Intention to recommend |
0.30* |
0.11 |
0.28 |
0.34* |
0.26 |
|
Satisfaction with food |
0.34* |
0.24 |
0.15 |
0.32* |
0.19 |
|
Satisfaction with hospitality |
0.28 |
0.07 |
0.39** |
0.37* |
0.40** |

Fig. 4 – Plot of Z score of job satisfaction and ratio of strong satisfaction by company.
281.4. Relation between ES and profitability
As Heskett et al. (1997, 2008) pointed out for service–profit chain theory, many service companies that provide customer service such as restaurants or retail shops have clear awareness that ES engenders higher CS, which in turn engenders higher profits. Many studies have examined how increasing customer satisfaction can stimulate future consumption or increase willing-to-pay premium prices, which in turn can increase the profitability of service firms (Mittal, Kamakura, 2001; Andersen et al., 1994). However, it is often difficult to find a direct relation between the level of employee satisfaction and profitability among different companies because business models vary according to companies, even in the same business category. For, example, Yee et al. (2008) used data of 206 service shops in Hong Kong to present empirical evidence that ES plays a significant role in enhancing the operational performance of organizations in the high-contact service sector. In the study, they asked the shop persons to assess their shop’s profitability relative to industry norms using subjective evaluation. Although that is one effective means of comparing profitability among companies, more quantitative means of assessing the relation between ES and profitability are desired from a management perspective.
One effective means of clarifying relations between ES and profitability is to make comparisons between stores of the same service company. For services with strong customer touch points, such as apparel shops, the level of employee satisfaction was found to have a strong effect on sales. Therefore, we investigated the case of a Japanese apparel company which operates 825 shops in Japan (Nishikoori et al., 2018).
As for ES, earlier empirical studies of service-profit chain (Yee et al., 2008, 2010) have specifically examined employee loyalty, which refers to a service employee’s feeling of attachment to the employer organization (McCarthy, 1997). Among the indicators of ES presented in section 1.1, “worthwhileness of working”, “sense of belonging” and “intention of recommendation” are included as job satisfaction factors. These questions are also closely related to employee loyalty. Therefore, we defined “employee loyalty level” by the normalized score of those three questions.
We divided the 825 shops into five groups based on “employee loyalty level”: Top 10% employee loyalty level as Rank-S; the next 20% 29as Rank-A; the next 40% as Rank-B; the next 20% as Rank-C; and the bottom 10% as Rank-D. Table 4 presents an example of results reflecting the relation between the employee loyalty rank of apparel shops and year-on-year sales. Results show that sales of rank S shops increased the most among all ranks. We also found that sales of rank D shops did not increase compared to those of other groups. Certainly, the apparel shop sales are influenced by product popularity, but all shops of the same company sell almost identical goods. For that reason, the relationships with customers and skills to recommend attractive clothes are important points related to improved sales.
Whereas analyses using year-over-year sales per store are insufficient, we are interested in identifying how increasing an individual’s ES can contribute to enhancement of labour productivity. In future studies, we would like to clarify details of the relation between productivity or value added by each employee and CS and ES using more detailed data. Through such analyses, we aim to build a computable model of the service system. The next section proposes a generalized service system considering CS, ES, and profitability based on the empirical findings presented above.
Tab. 4 – Year-on-year sales at an apparel company for respective loyalty ranks.
|
Employee loyalty Rank |
Year-on-year sales (2018/03) |
|
Rank S |
+13.6% |
|
Rank A |
+8.6% |
|
Rank B |
+9.1% |
|
Rank C |
+9.4% |
|
Rank D |
+4.1% |
2. Model formulation
as a generalized service system
This section presents a proposal of a theoretical service model constructed from a game theoretic viewpoint according to empirical data of CS, ES, and profitability. As described in the previous section, employees and customers share mutual relations. For that reason, we use the idea of game theory, treating interdependent decision-making situations mathematically. Then, based on findings presented in the previous section, we construct a simplified model formulated within the game theory framework comprising players of three kinds: managers, employees, and customers. Details of the model are explained in the following subsections.
2.1. Formulation of a service
To formulate a service, we make the fundamental assumption that a service is defined by some key factors which can dictate its quality and customer satisfaction. For example, in the restaurant industry, factors such as food quality, server hospitality, and restaurant atmosphere can strongly affect the entire service quality and customer satisfaction related to consumption of the service. According to this idea, we express one service as a tuple of some factors such as  , wherein we designate
  as a “resource” as a generalized notion. In the model, the resources are supposed to be decision variables determined by a manager player or an employee player.
Now, we generally formulate a service  as
as
 ,
,
where  represents a Cartesian product of each resource set
  . Herein
  denotes the number of resources. Additionally, to express the same service, we occasionally use another form as well:
  . It signifies, for instance, that resources are separated into the manager’s side and employee’s side as
  and
and  .
.
2.2. Manager player (Company player)
The model has multiple manager players who independently run a business supplying some service to the market. The set of manager players is  . For convenience, a service business that a manager player
  runs is simply called service business
  . Each manager player makes decisions about managerial issues to maximize profit. For simplicity, we assume that each decides a service price
  and employee pay
  and the resources of service
  . Then the manager
  payoff function is defined as
 ,
,
where  and
and  respectively signify the number of service users and the total cost for running the service business. Therein,
  represents a demand function under which a service
  is provided at price
  , which is the aggregation of respective customer player’s decisions. As described later (subsection 2.4), a customer is defined as a player who makes a decision of whether to consume a service, or not. Therefore,
  represents the sum of customers who decide to consume the service.
2.3. Employee player
The model has multiple employee players, each of whom works in a service business. An employee player provides a service directly to a customer. The set of employee players in service business  is defined as
  . Each employee player makes decisions about the resources of service
  to maximize the employee’s own benefit. This decision of selecting
  can represent an effort to acquire skill and knowledge through employee education or by other means. That effort incurs some sort of cost.
The payoff function of an employee player  in service business
  is
is
 ,
,
where  stands for the employee satisfaction of employee
  ,
,  expresses the pay that manager
  has decided to give the employee, and
  represents the cost. Also,
  stands for the total customer satisfaction felt by customers to whom employee
  has provided a service. As one might infer,
  is a function of
  .
.
The most characteristic point of this model is that an employee can acquire some sort of satisfaction from CS in addition to salary. Based on empirical analysis of ES as introduced in the previous section, a feeling of job meaningfulness or a sense of customer satisfaction can enhance an important point of ES: job autonomy. Although service–profit chain theory emphasizes the influence of ES on CS, the model explicitly includes the fact that CS can also enhance ES.
2.4. Customer player
Multiple customer players exist in the model. The set of customer players is  . The role of customer players is simply to enjoy a service by paying a service price. However, because of “heterogeneity” as a characteristic of services, customer satisfaction varies depending on the service context. To address that feature, we formulate customer satisfaction of a customer player
  as a sort of real-valued function.

Therein,  stands for the set of all employee players. That is,
  . Accordingly,
  above can represent a service context, meaning that even if the same service is provided, a different employee can alter its context. Therefore, the satisfaction can differ. Furthermore, this mapping of
  differs depending on customers, so that subscript
  is assigned. This differentiation also represents an aspect of heterogeneity.
For the model, we assume that each player chooses a service business  from its set
  , or that a player does not consume any service. Or rather, for some situations, each player might directly choose an employee
  in service business
  as a service provider. Thereby, we define the payoff function of a customer player
  as shown below.
Formally, when choosing a service business  without provider designation, its service provider
  would be determined on a service operation basis. In that case,
  is replaced by
  , wherein
  represents a mapping of
  . To maximize the payoff function, a customer player
  chooses a service business
  , or an employee e directly.
A model structure overview is presented in Figure 5. Our study addresses this triangle diagram as a service system.

Fig. 5 – Model overview.
3. Computer simulation of service systems: redesigning the pay structure
This section presents description of our conduct of a numerical simulation with our model, specifically setting up parameters to replicate an empirical situation of the restaurant service business. Particularly, this simulation addresses issues of re-designing a pay structure for employees. In the retail industry, various pay structures aside from fixed wage systems such as incentive compensation or bonus programs have been introduced to motivate sales personnel to provide 34enhanced customer services. Incentive compensation has been studied in economics and management accounting in terms of agency theory (Basu, 1985). However, earlier studies mainly examined the structure of compensation contracts for top executives. Banker et al. (1996) specifically examine frontline workers of a retail company, and report on a field test of the multi-period incentive effects of a performance-based compensation plan for sales. They reported that the plan implementation is associated with increases in sales that persist and increase over time with a statistical model. However, the mechanism considering the service system, which includes employees, customers, and firms, was not modelled in their study.
Gratuity systems, especially appearing in restaurant businesses, have been discussed mainly from a hospitality management perspective. Lynn and McCal (2016) report that tipping is affected predominantly by social expectations, server attractiveness, server friendliness, and customer mood. Service quality and cost considerations appear to exert only weak effects on tipping. Although gratuity systems have not been studied from a service system viewpoint, they represent a possible mechanism to enhance the total profit of a service system.
Against that backdrop, we prepare and compare pay structures of four kinds in the simulation: fixed pay, sales-proportional pay, CS-proportional pay, and gratuity by customers.
3.1. Parameter setting
This subsection explains parameters used in the simulation, which are arranged to reflect a situation of restaurant service business.
3.1.1. Resources
In the simulation, we selected representative resources of three kinds, as shown in Table 5, which can represent fundamental factors in a restaurant service business. Therefore, a service is expressed by  . Herein,
  and
and  are determined by a manager player and
  by an employee player.
Tab. 5 – Explanation of resources.
|
Variable |
Meaning |
Who decides? |
Explanation |
|
|
Food quality |
Manager |
Represents a level of food quality, defined as a real number |
|
|
In-store atmosphere |
Manager |
Represents a level of in-store atmosphere, which is affected by interiors, etc. It is defined as a real number |
|
|
Hospitality |
Employee |
Represents a level of hospitality that an employee player provides to a customer. It is defined as a real number |


 . If high, a customer is likely to obtain a high CS.
 . If high, a customer is likely to obtain a high CS.
3.1.2. Restaurant player (manager player)
We herein designate a manager player as a “restaurant player”. For the simulation, we assume that two restaurant players exist. When a restaurant player chooses  , as a cost function, the player incurs its cost as
 ,
,
where f signifies the fixed cost,  represents the sales, and
  and
and  respectively denote the coefficients. Employee pay
  , which we assume with pay structures of four kinds, is explained in section 3.2. Fixed cost at the first term includes basic expenditures such as electricity and gas. The third term represents variable costs such as ingredient expenditures. The last term is also a sort of cost depending on
  , which stands for investment expenditures for equipment, in-store interiors, etc.
Parameters related to the cost function are set as shown in Table 6. Those values are set with consideration of empirical data in chain restaurant stores provided by a company collaborating with our study.
36Tab. 6 – Parameters related to restaurant players.
|
# of restaurants |
|M| = 2 |
|
Fixed cost |
f = 10,000 |
|
Cost coefficient for |
|
|
Cost coefficient for |
|

3.1.3.Employee player
For this simulation, we assume for simplicity that only two employee players exist at each restaurant. Then, as shown in section 2.3, each employee player has its own  , which is a function of pay and customer satisfaction. Here, for a case in which service
  is provided, the function is set as
 ,
,
where  represents the pay for employee
  and
and  denotes the subset of the customer set
  to whom employee player e provides a service. In addition,
  and
and  are coefficients. Here, we assume employee players of two types, for whom the coefficients differ. The parameters are presented in Table 7. Type 1 signifies an employee who feels satisfaction evenly from pay and CS. A Type 2 employee does not feel satisfaction from CS. Especially for Type 2, it expresses the situation of kitchen staff because, generally in chain restaurant shops, they have no chance to have direct contact with customers. this simulation has one employee player for each type in each restaurant.
Next, the employee cost is simply set up as a linear function  , where
  signifies a coefficient. This cost function means that an employee player requires some effort at service hospitality to customers. That is to say, greater effort is necessary as the hospitality level increases.
Tab. 7 – Parameters related to employee players.
|
Type 1 |
Type 2 |
|
|
Coefficient for pay |
|
|
|
Coefficient for CS |
|
|
|
Cost coefficient |
|
|
|
# of employees in restaurants 1 and 2 |
|
|


3.1.4. Customer player
We set up 200 customer players in the simulation. As explained already in section 2.4, the customer players respectively have different  . For simplicity, we assume that the difference of serving employees does not affect customer satisfaction, but that the difference of service resources does affect it. Then, in a case where restaurant and employee players choose
  as resources, the customer player’s CS is assumed as
 ,
,
where  ,
,  , and
, and  respectively represent coefficients. For customers of different types, these coefficients vary similarly to employee satisfaction types. Table 8 presents relevant details.
Tab. 8 – Parameters related to customer players.
|
Type A |
Type B |
Type C |
|
|
Coefficient for resource |
|
|
|
|
Coefficient for resource |
|
|
|
|
Coefficient for resource |
|
|
|


3.2. Pay structures of four kinds
In most cases today, Japanese chain restaurants adopt a fixed pay system for employees and part-time workers: the pay amount is constant and is unaffected by employee performance. However, a trend toward reconsideration of such a fixed pay structure exists in the restaurant industry of Japan. Although it might not be realistic in some cases, the following four structures are used for the simulation.
3.2.1. Pay structure 1: Fixed pay (current)
Pay for an employee is fixed. Therefore, each employee obtains the same amount of money no matter how many customers to whom they provide a service. Thereby, the pay that an employee player  in service business
  receives is described simply as shown below.

In the simulation, the restaurant players choose the constant value independently.
3.2.2. Pay structure 2: Sales-proportional pay
The amount of pay for an employee is determined as proportional to the restaurant sales. Formally, the sales goal is set. The pay increases only if the restaurant player’s sales exceed the goal value. Its formula is
 ,
,
where  signifies restaurant
  sales,
  represents the goal, and
  is a coefficient. If the sale is less than the goal, then the pay is equal to that given in the case of fixed pay.
3.2.3. Pay structure 3: CS-proportional pay
The pay amount is proportional to customer satisfaction. We define its formula as
39 ,
,
where  represents the total amount of customer satisfaction that the employee player e can bring about. In addition,
  is a coefficient.
In fact, this pay structure might be unrealistic in practice because it is generally difficult to quantify the magnitude of customer satisfaction that each employee induces. In this pay structure, however, employees are expected to be motivated to behave in a manner that increases customer satisfaction.
3.2.4. Pay structure 4: Gratuity
Gratuities are used in no industry in Japan. Nevertheless, we consider this pay structure as an alternative. According to this pay structure, in addition to fixed pay, an employee can obtain additional pay directly from customers as a gratuity. The formula of employee payoff function can be described as shown below.

Therein, tc denotes the amount of gratuity that a customer player c pays. The last term is added independently of employee pay. Consequently, we regard pay from gratuity as different from ordinary pay. Comparing the case of CS-proportional pay, this pay structure can motivate employees with no additional restaurant expense.
Because a customer player tips a service provider (employee player), we re-define the customer player’s payoff function as shown below.

Therein, ag signifies the ratio expressing how much gratuity they pay. As the formula above shows, the amount depends on the customer payoff magnitude.
The parameters are presented in Table 9. We compare the performance of service systems under the following four respective pay structures.
40Tab. 9 – Parameters related to pay structure settings.
|
Coefficient of sales-proportional pay |
|
|
Coefficient of CS-proportional pay |
|
|
Gratuity ratio |
|


3.3. Decision-making flow in simulation
Within the formulation presented in section 2, we run a forward simulation in which each player makes decision in a sequential manner. Figure 6 presents the decision flow of the respective players.

Fig. 6 – Decision flow of players in simulation.
41As presented in Figure 6, the respective players choose their decisions on a step-wise and best-response basis: under the assumption that other players keep the same decision in the previous step, each player seeks the best response to maximize the payoff function. Of course, in the same step, players can observe and use information about earlier decisions than self.
However, because it is a forward decision-making process, it is not guaranteed that it always reaches Nash equilibrium. Only for customer players, are their decisions very simple: the task is to choose a service from several service businesses or not, so that rational decisions are possible. Accordingly, in simulation, 200 new customer players are added at the beginning of each step, each of whom is assigned a type A, B, or C with probability 1/3.
3.4. Simulation results
In the simulation, we simply modelled each player game-theoretically as taking a best response given other players’ observed decisions. Simulation results are presented in Tables 10a and 10b. Results represented in the tables were averaged by data during 100 periods after convergence to the average. We separate  into two values,
  and
and  , for the respective employee types.
The results demonstrate that the gratuity pay system outperforms others, presenting the highest social surplus. In a gratuity case, because customer players give additional payments in addition to the service price, the payoff is presumed to be reduced. However, contrary to expectations, the customer benefit becomes larger. Furthermore, interestingly, except for the fixed-pay case,  presents high values. Intuitively, because Type 2 employees do not care about customer satisfaction, it is natural to infer that
  is small, as in the case of a fixed pay structure. However, in those three cases, Type 2 employees chose high
  because of incentivized pay structures. Results imply that such pay structures can bring about good effects for employees who do not care about service hospitality.
Tab. 10a – Simulation results: average resource values.
|
Fixed |
Sales-proportional |
CS-proportional |
Gratuity |
|
|
Food quality |
120 |
120 |
110 |
124 |
|
Atmosphere |
54 |
83 |
90 |
99 |
|
Type 1 employer’s hospitality |
193 |
188 |
191 |
190 |
|
Type 2 employer’s hospitality |
50 |
182 |
191 |
190 |


Tab. 10b – Simulation results: average payoff.
|
Fixed |
Sales-proportional |
CS-proportional |
Gratuity |
|
|
Restaurant |
-11,652 |
16,222 |
7,810 |
24,797 |
|
Employee |
24,268 |
30,550 |
32,982 |
40,978 |
|
Customer |
8,012 |
16,070 |
12,633 |
19,555 |
|
Social surplus |
20,628 |
62,842 |
53,426 |
85,330 |


3.5. Discussion
Although the simulation model results presented above portray only a simplified perspective of services, they suggest the possibility of improving actual service, spurring companies to rethink their business models using observable indicators acquired in their services. It is often difficult for service company managers to change their business models or internal rules because they worry about whether a new business model will work or not. From an academic viewpoint, although researchers should demonstrate possibilities of enhancing productivity of services with a new service system, it is often difficult to present the probability of a proposed model because many aspects of service systems must be assessed or simulated simultaneously. Computational models of service systems based on game theory and actual data can be useful to elucidate mechanisms of complex service systems and to create new and more sustainable service systems.
43Conclusions
This paper introduces a method of assessing service systems using standardized indicators representing some important aspects of computer simulation and services: CS, ES and profitability. Although our efforts at standardizing indicators related to ES, CS, and profitability are still underway, quantitative and computational approaches to elucidating service systems must be regarded as increasingly important for service research. Service industries are adversely affected by many factors, but they are expected to seek new strategies to enhance productivity considering value for consumers and employees in a sustainable fashion.
As described in this paper, the first data analysis ascertained important factors in CS as well as in ES. Additionally, the correlated relation among CS, ES, and profitability are clarified. Based on those findings, a game-theoretic model that captures a service system structure was constructed. With the model, numerical simulation compared four kinds of employee pay structures. As a result, although operating under a specific parameter set, we found an interesting result, implying that an incentivized pay structure such as that with gratuities can not only increase company profits, but also result in enhancement of the employee’s provided degree of hospitality. Even for a Type 2 employee, who is modelled as a player caring little for hospitality, the hospitality level might be enhanced. This is an important implication in face-to-face type service industries such as the restaurant industries because it can invoke some sort of value co-creation situation between customers and employees.
Another interesting implication was identified through numerical simulation. The fixed pay structure case presents negative profit under a specific parameter set that we use. However, under the same parameter set, other pay structures demonstrated positive profit because the amount of pay is determined as proportional to an employee’s individual performance. That finding in turns implies that if no employee provides high levels of hospitality, it leads to low demand for the service, which might pose a severe difficulty. The simulation reveals that even under a harsh environment with low demand, an appropriate pay structure might be sufficient to cope with such difficulties.
44Recently, digital technologies are changing existing business models of services such as banking, transportation, e-commerce, and other customer services (Vail, 2019). However, traditional and labour-intensive service industries represented by restaurants, hotels, and nursing care services continue to struggle with diverse issues such as labour shortages, high labour costs, and increasing costs of food and natural resources. Those industries are important not only for the economy but also for maintaining the quality of life of local people. Therefore, many service companies are attempting to alter their business models to more value-added or sustainable ones. Accordingly, labour productivity and re-design of services and jobs considering employee and customer satisfaction are drawing considerable attention again.
Future studies must be undertaken through strong partnership with service companies to explore more concrete examples of the redesign of services based on multiple indicators and more realistic methods of using computational models.
45References
Anderson E. W., Fornell C., Lehmann D. R. (1994), “Customer satisfaction, market share, and profitability: Findings from Sweden”, Journal of Marketing, vol. 58, no 3, p. 53-66.
Banker R. D., Lee S. Y., Potter G. (1996), “A field study of the impact of a performance-based incentive plan”, Journal of Accounting and Economics, vol. 21, no 2, p. 195-226.
Basu A.K., Lai R., Srinivasan B., Staelin R. (1985), “Salesforce compensation plans: An agency theoretical perspective”, Marketing Science, vol. 4, no 4, p. 267-291.
Chi C. G., Gursoy D. (2009), “Employee satisfaction, customer satisfaction, and financial performance: An empirical examination”, International Journal of Hospitality Management, vol. 28, no 2, p. 245-253.
Dick A. S., Basu K. (1994), “Customer loyalty: toward an integrated conceptual framework”, Journal of the Academy of Marketing Science, vol. 22, no 2, p. 99-113.
Fornell C. (1992), “A national customer satisfaction barometer: The Swedish experience”, Journal of Marketing, vol. 56, no 1, p. 6-21.
Fornell C., Johnson M. D., Anderson E. W., Cha J., Bryant B. E. (1996), “The American customer satisfaction index: nature, purpose, and findings”, Journal of Marketing, vol. 60, no 4, p. 7-18.
Fukao K., Ikeuchi K., Kim Y., Hyeog Ug K. (2015), Why Was Japan Left Behind in the ICT Revolution?, Discussion papers 15043, Research Institute of Economy, Trade and Industry (RIETI). https://ideas.repec.org/p/eti/dpaper/15043.html (retrieved on March 2020).
Greenleaf R. K. (2002), Servant leadership: A journey into the nature of legitimate power and greatness, USA: Paulist Press.
Hennig-Thurau T., Klee A. (1997), “The impact of customer satisfaction and relationship quality on customer retention: A critical reassessment and model development”, Psychology & Marketing, vol. 14, no 8, p. 737-764.
Herzberg F., Mausner B., Snyderman B. B. (1959), The motivation to work, New York: John Wiley & Sons.
Heskett J. L., Jones T. O., Loveman G. W., Seaser Jr. W. E., Schlesinger L. A. (2008), “Putting the service-Profit Chain to Work”, Harvard Business Review, vol. 72, no 2, p. 164-174.
Hogreve J., Iseke A., Derfuss K., Eller T. (2017), “The Service–Profit Chain: A Meta-Analytic Test of a Comprehensive Theoretical Framework”, Journal of Marketing, vol. 81, no 3, p. 41-61.
46Judge T. A., Thoresen C. J., Bono J. E., Patton G. K. (2001), “The job satisfaction –job performance relationship: A qualitative and quantitative review”, Psychological Bulletin, vol. 127, no 3, p. 376-407.
Kotler P., Armstrong G. (2008), Principles of Marketing, 12th ed. Upper Saddle River, NJ: Pearson Education, Inc.
Kotler P. (1994), Marketing Management: Analysis, Planning, Implementation, and Control, Eighth edition., Englewood Cliffs, NJ: Prentice Hall.
Lynn M. M., McCall M. (2016), Beyond Gratitude and Gratuity: A Meta-Analytic Review of the Predictors of Restaurant Tipping. Retrieved March, 2020, from Cornell University, SHA School site http://scholarship.sha.cornell.edu/workingpapers/21.
McCarthy D. G. (1997), The Loyalty Link, How Loyal Employees Create Loyal Customers, John Wiley & Sons, New York.
Mittal V., Kamakura W. A. (2001), “Satisfaction, repurchase intent, and repurchase behaviour: Investigating the moderating effect of customer characteristics”, Journal of Marketing Research, vol. 38, no 1, p. 131-142.
Morikawa M. (2007), Is productivity in the service industries low? An analysis using firm-level data on the dispersion and the dynamics of productivity, RIETI Discussion Paper 07-J-048.
Morikawa M. (2010), Working Hours of Part-timers and the Measurement of Firm-level Productivity (Japanese). Research Institute of Economy, Trade and Industry (RIETI).
Nishikoori H., Takenaka T., Maehara N., Tsuji H., Shibuya U. (2018), “Effective improvement of employee satisfaction and service quality considering maturity levels of employee loyalty”, in Proc. of ICServ2018, Taiwan.
Parris D. L., Peachey J. W. (2013), “A systematic literature review of servant leadership theory in organizational contexts”, Journal of Business Ethics, vol. 113, no 3, p. 377-393.
Sasser W. E., Schlesinger L. A., Heskett J. L. (1997), Service profit chain, London, Simon and Schuster.
Takenaka T., Nishino N. (2017), “Nature of value and emergent synthesis”, Procedia CIRP 62, p. 90-93.
Ueda K., Takenaka T., Nishino N. (2017), “Service as artifact: reconsideration of value cocreation”, in Sawatani Y., Spohrer J., Kwan S., Takenaka T. (eds.), Serviceology for Smart Service System, Tokyo, Springer, p. 307-316.
Vial G. (2019), “Understanding digital transformation: A review and a research agenda”, Journal of Strategic Information Systems, vol. 28, no 2, p. 118-144.
Watanabe K., Mochimaru M. (2017), “Expanding impacts of technology-assisted service systems through generalization: Case study of the Japanese Service Engineering Research Project”, Service Science, vol. 9, no 3, p. 250-262.
47Watanabe K., Mochimaru M., Shimomura Y. (2016), “Service engineering research in Japan: Towards a sustainable society”, in Jones A., Ström P., Hermelin B., Rusten G. (eds), Services and the Green Economy, London, Palgrave Macmillan, p. 221-244.
Wilson A. M. (2001), “Mystery shopping: Using deception to measure service performance”, Psychology & Marketing, vol. 18, no 7, p. 721-734.
World Health Organization (2015), Health in 2015: from MDGs, millennium development goals to SDGs, sustainable development goals, World Health Organization.
Yee R. W., Yeung A. C., Cheng T. E. (2008), “The impact of employee satisfaction on quality and profitability in high-contact service industries”, Journal of Operations Management, vol. 26, no 5, p. 651-668.
Yee R. W., Yeung A. C., Cheng T. E. (2010), “An empirical study of employee loyalty, service quality and firm performance in the service industry”, International Journal of Production Economics, vol. 124, no 1, p. 109-120.
- Thème CLIL : 3306 -- SCIENCES ÉCONOMIQUES -- Économie de la mondialisation et du développement
- ISBN : 978-2-406-11028-6
- EAN : 9782406110286
- ISSN : 2555-0284
- DOI : 10.15122/isbn.978-2-406-11028-6.p.0017
- Éditeur : Classiques Garnier
- Mise en ligne : 19/10/2020
- Périodicité : Semestrielle
- Langue : Anglais
- Mots-clés : satisfaction des employés, système de service, simulation, structure salariale, ingénierie du service