
La perception de la qualité du riz par les Laotiens Les apports d’une analyse conjointe
- Type de publication : Article de revue
- Revue : Systèmes alimentaires / Food Systems
2018, n° 3. varia - Auteurs : Chialue (Lytoua), Moustier (Paule), Manivong (Phengkhouane)
- Résumé : Une analyse conjointe à partir d’enquêtes auprès de 300 consommateurs urbains du Laos a permis de connaître les facteurs influençant leur perception de la qualité du riz. Les points de vente et la certification biologique ont une influence majeure. Le point de vente préféré pour ces attributs est le marché de plein vent, suivi des supérettes et des vendeurs de rue. L’amélioration de la certification biologique et le maintien des marchés traditionnels sont les principales implications managériales.
- Pages : 61 à 87
- Revue : Systèmes alimentaires
- Thème CLIL : 3306 -- SCIENCES ÉCONOMIQUES -- Économie de la mondialisation et du développement
- EAN : 9782406087229
- ISBN : 978-2-406-08722-9
- ISSN : 2555-0411
- DOI : 10.15122/isbn.978-2-406-08722-9.p.0061
- Éditeur : Classiques Garnier
- Mise en ligne : 10/12/2018
- Périodicité : Annuelle
- Langue : Anglais
- Mots-clés : Consommateur, qualité des aliments, sécurité sanitaire, analyse conjointe
Laotian consumer perceptions
of rice quality
Insights from a conjoint analysis1
Lytoua Chialue
Faculty of Agriculture,
National University of Laos, Vientiane Capital, Lao PDR
Paule Moustier
CIRAD, UMR MOISA
F-34398 Montpellier, France
Phengkhouane Manivong
009/02 Ban Fay, Saysettha district Vientiane Capital, Lao PDR
Introduction
Food consumption patterns are slowly changing as a result of food safety issues. Urban consumers in developing countries, including Lao PDR, now have access to food by purchasing it rather than producing it.
62Like many Asian countries, Lao PDR has experienced rapid urban and economic development, although it is still a predominantly rural country. The urban population represented 38 in 2014, with urban growth of 4.13 % between 2010 and 2015 and gross domestic product (GDP) growth of 8 % in 2013. In parallel to this development, the transition from traditional to market-based agriculture has been ongoing since the early 2000s. Intensive commercial agriculture has been promoted, with increasing use of chemical inputs. High pesticide residues have been identified, mainly in fruit and vegetables. While infectious diseases have decreased, new food-related diseases have appeared (Strigler, 2011).
Against this backdrop, the Ministry of Health in the Lao PDR has developed a regulation on the labeling of prepackaged food (No.519/MoH.2009) and a national policy and action plan for food safety which serves as a framework for the control of food and agricultural products throughout the food chain (No.020/MoH.2009).
Meanwhile, organic agriculture has been promoted through international development projects since the early 2000s under the name ‘Laos Organic Agriculture’. Organic agriculture is also a priority in the Laos agricultural development strategy. The organic standard was developed and adopted by the Ministry of Agriculture and Forestry (MAF) and various NGO projects in 2005 (No. 1666/MAF). According to the 2020-2030 agricultural development strategy, the MAF aims at 70,000 producers being certified as organic. Currently, there are three organic standards in the Lao PDR: one for rice, one for coffee, and one for crops. At the national level, the Lao Certification Body (LCB) was set up under the aegis of the MAF’s Clean Agricultural Development Center (CADC), which inspects and provides organic certification for production (from planting to harvesting products, processing, storage, packaging and sale) and processing systems (from product and raw material management to processing methods, packaging, transport and distribution). With the support of the government, the CADC has developed two labels for so-called clean agriculture: one for organic agriculture (mainly for rice, coffee and crops) and one for good agricultural practices.
Lao PDR is also experiencing changes in its retailing formats. Although wet markets are still the dominant place for the purchase 63of food, minimarts have emerged in the last ten years. These formats promote specific quality, i.e. in terms of the way food is presented and stored in addition to a certain emphasis placed on the traceability of suppliers. Furthermore, the regulation on the labeling of prepackaged food was adopted in 2009. This regulation is meant to help consumers obtain information on the origin and contents of food products sold in wet markets and minimarts. In this paper, we investigate how Laotian consumers assess food quality in this new context of promoting quality and changes in retailing formats. From a preliminary literature review, we consider four factors in the supply chain that can deliver a credible message on quality to consumers: (1) the packaging of the food products; (2) an indication of the country of origin; (3) the place of purchase (wet market, modern market, mobile vendor) where consumers go regularly to buy food products; and (4) quality certification (in this case, organic). In addition to a global assessment of consumer perceptions of rice quality, we performed a conjoint analysis with four attributes and three levels of attributes.
The paper is organized as follows. The first section is as introduction followed by the literature review, resulting in the objectives and hypotheses of the paper. The second section describes the research methodology including details on the performed conjoint analysis and date collection. The third section investigates how consumers assess food quality. Finally, we summarize and discuss our findings, outline some recommendations and limitations of our study.
1. Literature review and hypotheses
1.1. Definition of food quality
We consider food quality here from the point of view of consumers. Food quality has been characterized by two dimensions, namely quality cues and quality attributes (Grunert, 2005). Quality cues can be defined as the characteristics of food which can be ascertained by the senses prior to consumption (Ophuis and Trijp, 1995). Quality cues include intrinsic product cues (i.e. appearance, shape, color of food) and 64extrinsic product cues (i.e. place of origin, labeling, convenience and the place of sale). Quality cues have been widely used to predict consumer perceptions of several food products (for i.e., Ortegaet al., 2011; Grunertet al., 2015). Food quality attributes are benefit-generating aspects of the product, which cannot be observed before consumption (Ophuis and Trijp, 1995). Quality attributes include experience and credence quality attributes. Experience quality attributes relate to taste, freshness and convenience while credence quality attributes are based on the trust of consumers, for instance the impacts on health and the environment. Safety may be considered as a dimension of quality (Grunert, 2005; Uyttendaeleet al., 2015), because quality refers to specific characteristics that make the food safe. Quality and safety are actually intertwined in consumers’ minds (Rijswijk and Frewer, 2008). In this paper, we will use the word food quality in a broad sense incorporating food safety. Various authors define food safety according to the risks relative to food consumption (i.e. relative to chemical and pesticide residues) and to the control system in the food chain (Grunert, 2005). Food safety refers to credence attributes, i.e. attributes not directly observable by the user, which create the most uncertainty concerning quality (Darby and Karni, 1973), compared to search and experience attributes (Nelson, 1970). Labels transform credence attributes into search attributes (Grolleau and Caswell, 2006).
Consumers in different countries may consider different aspects in what they define as food quality. Rijswijk and Frewer (2008) examined consumer perceptions of food quality (including safety) and their relation to traceability in four EU countries (France, Germany, Italy and Spain). While German and Italian consumers consider that quality refers to freshness, taste and natural or organic processes, the French relate quality to appearance and taste. Whereas safety refers to risk and healthiness in the minds of Germans and Italians, it is defined by controls and guarantees by the Spanish and by proper food handling and food chain management by the French. The authors also conclude that consumers in Mediterranean countries pay more attention to food quality in a strict sense, whereas consumers in the northern EU are more concerned by food safety.
651.2. The role of retail outlets
The perception of food quality is influenced by the place of purchase. Tilmanet al. (2000) suggested that the place of purchase plays an important role in establishing consumer trust for the source information in terms of food safety. In developed countries, most consumers purchase food from modern distribution chains, even though direct selling is still important for fresh food in a number of European countries. Most consumers in developing countries, including Lao PDR predominantly buy food from traditional markets including wet markets and mobile vendors. In Malaysia, night markets, farmers’ markets and wet markets are the main places where consumers purchase fresh meat (Chamhuri and Batt, 2013). In terms of quality, they declare that fresh meat should be fresh (96 %), Halal guaranteed (30 %) and from a good environment (27 %). The freshness of food products (i.e. fresh meat) is guaranteed in wet markets (96 %) followed by supermarkets (71 %). In Vietnam, while wet markets are perceived by consumers as the best in terms of freshness for food, supermarkets are considered to provide safer food than wet markets (Figuié and Moustier, 2009; Wertheim-Heck and Spaargaren, 2016).
1.3. The role of product labels and packaging
Product labels and packaging also influence consumer perception of food quality. Tsakiridouet al. (2011) assessed consumer knowledge, attitudes and beliefs relating to food safety, traceability and certification labels for fresh produce in Greece. They showed that the most important criteria when buying vegetables are the nutritious value, food safety, certification and indication of origin. In other research conducted by Janssen and Hamm (2012), a choice experiments approach was employed to analyze consumer preferences and willingness to pay for different organic certification logos (EU logo, governmental and private logos) for apples and eggs in six European countries. Both choice experiments and group discussion were conducted in two kinds of shop: 1) conventional supermarkets, or shopping centers, and 2) organic food shops. They show that consumers prefer products with a certification logo as well as with strict standards and control systems. They conclude that third-party 66certification is insufficient and that consumer trust in the certification scheme is crucial. A conjoint analysis on organic canned peeled tomatoes in Italy shows that consumers attach most importance to the price (but are willing to pay a premium) followed by local origin, while certification ranks last (Annunziata and Vecchio, 2016). This result is similar to the other studies conducted in some European countries: the findings of Denver and Jensen (2014) showed that consumers have a strong positive preference for domestically grown food produce (i.e. apples) over imported food produce, while Šárka and Giacomo (2015) reported that consumer favor national labels over foreign labels (i.e. EU label). Moreover, consumer preferences and willingness to pay for organic products is higher with a ‘local’ rather than ‘foreign’ indication (Hempel and Hamm, 2016). Another choice study conducted in China by Grunertet al. (2015) shows that intrinsic product attributes (i.e., fat content, color) are highly significant in terms of the quality of meat (i.e., pork ribs), whereas extrinsic product attributes (i.e. certification body, place of origin) are of minor importance when making decisions to purchase food products.
One factor that is related to labelling and affects quality is packaging. To be labelled, a product commonly needs to be packaged. Furthermore, packaging influences the shelf life of the product as well as its freshness and cleanliness, and consequently affects consumers’ perceptions and choices, although this factor is rarely taken into consideration in consumer studies (Koutsimaniset al., 2012).
Finally, various researches on consumer preferences and willingness to pay for labeled products, including organic foods, have shown that consumer characteristics – age, education, income, occupation, etc. – also influence consumer preferences (for i.e., Mergenthaleret al., 2009).
1.4. Objective and hypotheses
The questions we address are as follows: how do Laotian consumers perceive food products in terms of quality? Which factors in the supply chain affect the consumer perception of food quality? We choose to focus on rice because it is the most important food product in the Lao PDR in terms of volumes produced and consumed. The national 67production of paddy rice in Lao PDR is about 4 million tons and rice consumption per capita reached 162 kg in 2017. Moreover, there are growing initiatives to develop rice quality and raise awareness with regard to this. From the literature review, we draw the hypothesis that food quality and safety are multi-dimensional and intertwined. Their perception by consumers is influenced by the packaging, the place of purchase, the origin of the product (local –i.e. national, being preferred), and the certification. While these factors are often considered individually, we consider all four of them as well as their interaction in the present study. The hypotheses can therefore be formulated as follows:
H1: If rice is packaged, then quality is perceived to be higher
H2: If rice is sold in the minimart, then quality is perceived to be higher
H3: If the origin is local, i.e. from Lao PDR, then quality is perceived to be higher
H4: If rice is indicated as being organically certified, then quality is perceived to be higher
H5: If the different quality cues quoted before are combined, then quality is perceived to be higher.
2. Method
2.1. Survey data collection (2010)
The quantitative consumer survey was conducted between May and July 2010 in three big urban provinces in the Lao PDR: Vientiane Capital (which has the administrative status of a province), Luang Prabang and Champasak provinces. We chose to interview households in urban rather than rural areas because in rural areas most of the rice is supplied outside the market (through self-production or gifts), and one objective of the research is to help rice farmers to adopt an adequate marketing strategy when selling their rice. A random sampling strategy was developed in order to select respondents from the 68list of households given by the head of each province and a face-to face survey was conducted. The target sample size in each province was 100 consumers (making a total of 300 targeted consumers). We did not retain the interviewees who stated that they grew rice (amounting to 3 people), and we replaced them with the next people on the list. All selected respondents answered the questionnaires but four did so in an incomplete way, so that the final sample includes 296 questionnaires (i.e. a 98 % response rate)2.
The questionnaire was divided into two parts. The first part related to the consumer’s point of view regarding the quality dimension of rice. Several statements in terms of rice quality cues (freshness, shape of grain, no chemical residues, organic) were given to consumers regarding the quality of the rice. We then asked them the question ‘What is most important to you in terms of rice quality when you select rice for purchase?’
The second part related to conjoint experiment methods.
2.2. Conjoint analysis approach
The conjoint analysis (CA) approach can be used to assess consumer willingness to pay for different attributes (both food and non-food products), and this can help marketers to classify the multidimensional attributes of products according to their importance to consumers (Gustafssonet al., 2001). In recent research, conjoint analyses have been applied to consumer preferences and consumer willingness to pay for one or more attributes (for instance fat content, color, organic production method, packaging, the place of origin, organic logo) for different food products (Annunziata and Vecchio, 2013).
In this study, we applied a conjoint analysis to assess the main factors that deliver a credible message to urban consumers concerning quality. The conjoint design (Table 1) is based on four attributes in the supply chain: packaging (2 modalities), retail outlet (3 modalities), organic certification (2 modalities) and country of origin (2 modalities). We chose these modalities because they are deemed important in the 69literature and relevant to the Lao context. Branding of rice was not observed at the time of survey. We did not consider price attributes to predict consumer preferences for food quality because of the high price differences between different points of sale. We did, however, take account of its potential influence in the phrasing of the question, as we will see later on.
We now give some details about the selected modalities. In terms of packaging, rice can be sold in bulk (at wet markets) or in plastic bags (in all retail outlets). With regard to retail outlets, the wet market is the major place for consumers to make their daily food purchases whereas modern distribution outlets (in the form of minimarts) have only very recently appeared (during the last ten years). Consumers also commonly purchase their food from mobile (or street) vendors. Mobile vendors are found in all the districts of the city. They sell their produce directly on the street or sometimes at consumers’ front doors. For rice, they mostly sell from small trucks.
Tab. 1 – Product attributes and modality for conjoint analysis.
Source: designed by the team researcher of NUoL-FAO project, 2010.
|
Attributes |
Modality of attribute |
|
Packaging of products |
Packed Unpacked |
|
Retail outlet |
Wet market Minimart Mobile vendor |
|
Organic certification |
Indicated with organic standard seal Not indicated (without organic standard seal) |
|
Country of origin |
Indicated Not indicated |
In Lao PDR, organic certification in compliance with the national organic standard (Department of Agriculture, MAF) and international organic standards (IFOAM Asia, EU, NOP and JAS) is currently available for rice and other crops (national organic standards) as well as for coffee (national and international organic standards).
70The place of origin is commonly indicated at all retail outlets with regard to the country of origin (Lao PDR or Thailand).
The experimental design includes a series of steps that are very important because they may affect the efficiency of selection and information. For the data collection method, we decided to use the profiles method according to (Gustafssonet al., 2001). This assumes that the description of full profiles (detailed information of all attributes in a picture) that we propose for all attributes is close to the real situation. We then calculated the number of possible combinations of attributes resulting from the combination of each profile together with the different attributes. So, there are 2x2x3x2 = 24 product profiles.
It is impossible to use 24 product profiles when asking the consumers because the consumers would be confused by the volume of information. We applied a technique called Fractionate Factorial Design (in the SPSS command Orthogonal Design). The complete choice stimuli generated 10 final choice sets. Each respondent completed a conjoint experiment with 10 stimuli and the corresponding short description (see Appendix 1 and Table 2). The stimuli were presented in the same order for all respondents. The surveyors presented 10 stimuli (pictures) and explained each picture in more detail to consumers. They then asked the respondents the following question:“Without regard for price or convenience such as distance, please rank these pictures according to the quality that you can identify, where the first picture is the best quality rice and the last picture is the poorest quality rice”.Data from the choice experiment were analyzed using the Statistical Package for the Social Sciences (SPSS) software, version 18.
Tab. 2 – The product profile used for consumer conjoint experiments.
Source: generated by the author, 2010.
|
Number profile |
Combination of attributes |
|||
|
Packaging |
Retail outlet |
Organic certification |
Country origin |
|
|
A |
Packed |
Wet market |
Indicated |
Indicated |
|
B |
Unpacked |
Minimart |
Indicated |
Not indicated |
|
C |
Unpacked |
Mobile vendor |
Not indicated |
Indicated |
|
D |
Packed |
Wet market |
Not indicated |
Not indicated |
| 71
E |
Packed |
Mobile vendor |
Indicated |
Not indicated |
|
F |
Unpacked |
Wet market |
Indicated |
Indicated |
|
G |
Packed |
Minimart |
Not indicated |
Indicated |
|
H |
Unpacked |
Wet market |
Not indicated |
Not indicated |
|
I |
Packed |
Minimart |
Indicated |
Not indicated |
|
J |
Packed |
Mobile vendor |
Not indicated |
Indicated |
|
Ki |
Unpacked |
Minimart |
Indicated |
Indicated |
|
Li |
Packed |
Minimart |
Not indicated |
Not indicated |
|
Ni |
Unpacked |
Mobile vendor |
Indicated |
Not indicated |
|
Mi |
Unpacked |
Minimart |
Not indicated |
Not indicated |
i. Holdout
To estimate the consumer utilities on the quality of the rice, we used a regression model of consumer preference as a function of four attributes: packaging, retail outlets, organic certification and country of origin. Part-worth utilities of consumers were estimated by using regression analysis as ordinary least squares. Large part-worth utilities refer to the most preferred levels and small part-worth utilities are assigned to the least important levels. This means that the attributes with the largest part-worth utility range of consumers are considered the most important in predicting preferences.
2.3 Cluster analysis
Segments of consumers were distinguished by means of cluster analysis with respect to consumer preference for the different types of consumer perceptions of quality and safety. A non-hierarchical cluster analysis or k-means cluster analysis with nearest centroid sorting was performed to classify part-worth utility consumers by using the statistical software package SPSS 18. A three-cluster parameter was tested by crossing the groups of consumers with the other variables: socio-economic variables, frequency of buying rice and awareness of the organic logo similar to the study by Annunziata and Vecchio (2013). A one-way ANOVA analysis was used to compare each cluster means and variable related to consumer preferences for rice
722.4. Additional survey (2017)
In January 2017, to assess whether the main results obtained in 2010 still held some validity, we conducted interviews with 30 consumers distributed across four major retail markets in Vientiane capital (10 in Huakhoua market, 10 in Khouadin market, 5 in Nonsavang market and 5 in Thatluang organic market). The questions related to the place and frequency of rice purchase; the most important quality attributes; and how consumers obtain rice of the desired quality. This survey included 2/3 women and 1/3 men, aged between 30-40 years old, with two consumers over 50 years old and two under 20 years old. The small size of the sample implies extreme caution in using the results of this additional survey.
3. Results
3.1. Characteristics of respondents (2010 survey)
Food purchasing for the household is predominantly a task carried out by women (which is reflected in 79 % of the total respondents being female). The average age of respondents is 38. Most households (70 %) buy rice several times a month. The vast majority of respondents (97 %) have some form of formal education, with a clear majority being educated up to primary/secondary school level, whereas those with at least a bachelor’s degree account for 18.9 % of respondents. A large proportion of the working respondents are independent workers (self-employed) (38 %) and government employees (21 %) whereas employees of private companies account for only 6 %. Households have an average of five members and an average monthly income of USD 375, which is a slightly higher than the figure for the overall population of the three provinces, i.e. USD 297, which may result from the absence of rice-growing respondents, and different methods for income estimation and the difference in the period of survey (2007-2008 for the Department of Statistics, 2009-2010 for ours).
733.2. Rice quality criteria
The most quoted rice quality cues are: freshness (46 %), shape of grain (26 %) and no chemical residues (24 %). A small number (4 %) explicitly refer to organic rice which is a new product for consumers, as it was first introduced in 2007 (mainly in Vientiane). Consumers prefer to buy new rice, i.e. recently harvested (referring to freshness) rather than old rice (stored for a long time), which may affect the palatability. As we did not include it in the possible stated cues, it is logical that the place of purchase is not quoted. It actually reflects several quality cues, e.g., freshness and pesticide residues. In the 2017 survey, the same quality attributes were highlighted, with the following ranking: 1- shape (quoted by 19 of 30 consumers); 2- freshness (6 out of 30); 3- being organic (3 out of 30); and 4- no chemical residues (2 out of 30). Even though the sample is much too small to draw any definitive conclusions, it suggests that there is growing demand and understanding related to organic products.
3.3. Conjoint analysis result:
impact of quality attributes
From the results of the conjoint analysis in Table 3, the most important attribute influencing consumer preferences regarding rice quality is the retail outlet (39.50 %) followed by organic certification (29.33 %), packaging (16.55 %) and country of origin (14.61 %). Considering the utility value of each attribute is interesting because it displays both negative and positive values. The positive value of utility indicates that the level of each attribute is important to consumers while the negative sign shows they dislike the attribute. For instance, the negative sign associated with the attribute “purchase from mobile vendors” means that they dislike buying rice from mobile vendors when they look for quality. Hence, our hypothesis concerning consumers’ appreciation of rice quality being influenced by the place of purchase, the packaging of products, the indication of product origin and organic certification is confirmed, the place of purchase representing the most important factor followed by certification. The kendall’tau and pearson’s R values in the correlation in the table 3 are close to 1 (0.867 and 0.971 respectively), meaning that the correlation between the observation and the prediction is very high.
74The 2017 survey confirmed that the choice of the place of purchase is the first strategy for consumers to guarantee the desired quality of rice, the wet market being the preferred outlet.
Tab. 3 – Importance of the value of attributes.
Source: result from data analysis, 2010.
|
Attributes |
Levels |
Utility estimate |
Std. error |
Importance values |
|
Packaging |
unpacked |
-.199 |
.146 |
16.55 |
|
packed |
.199 |
.146 |
||
|
Retail outlet |
wet market |
.444 |
.195 |
39.50 |
|
minimart |
.259 |
.216 |
||
|
mobile vendor |
-.704 |
.216 |
||
|
Organic certification |
not indicated |
-.976 |
.148 |
29.33 |
|
indicated |
.976 |
.148 |
||
|
Country of origin |
not indicated |
-.257 |
.148 |
14.61 |
|
indicated |
.257 |
.148 |
||
|
(Constant) |
5.416 |
.146 |
||
|
Correlationsi |
||
|
Value |
Sig. |
|
|
Pearson’s R |
.971 |
.000 |
|
Kendall’s tau |
.867 |
.000 |
i. Correlations between observed and estimated preferences.
Table 4 illustrates the impact of the “organic certification” attribute on selected scenarios (A to J). The sum of utility values of scenarios “C, J, H, D” and “G” when the rice is sold without “organic certification” has a negative value, whereas scenarios “E, B, I, F” and “A” when the rice is sold with “organic certification” has a positive sum of utility value.
Tab. 4 – Gain in utility value of each scenario
75with regard to the attribute “certification”.
Source: data analysis, 2010.
|
Scenario |
Combination of attributes |
Sum of utility |
Gain in utility |
|||
|
Organic certification |
Retail outlet |
Country of origin |
Packaging |
|||
|
C |
Not indicated |
Mobile vendor |
Indicated |
Unpacked |
3.974 |
0 |
|
J |
Not indicated |
Mobile vendor |
Indicated |
Packed |
4.192 |
+ 0.398 |
|
H |
Not indicated |
Wet market |
Not indicated |
Unpacked |
4.428 |
+ 0.634 |
|
D |
Not indicated |
Wet market |
Not indicated |
Packed |
4.826 |
+ 1.032 |
|
G |
Not indicated |
Minimart |
Indicated |
Packed |
5.155 |
+ 1.361 |
|
E |
Indicated |
Mobile vendor |
Not indicated |
Packed |
5.630 |
+ 1.836 |
|
B |
Indicated |
Minimart |
Not indicated |
Unpacked |
6.195 |
+ 2.401 |
|
I |
Indicated |
Minimart |
Not indicated |
Packed |
6.593 |
+ 2.799 |
|
F |
Indicated |
Wet market |
Indicated |
Unpacked |
6.894 |
+ 3.100 |
|
A |
Indicated |
Wet market |
Indicated |
Packed |
7.292 |
+ 3.498 |
As shown in Table 4, Card “A” represents the scenario where rice has the best perceived quality (sum of utility = 7.292), followed by Card “F” and Card “I”, with 6.894 and 6.593, respectively. Scenarios “A”, “F”, and “I” describe a similar situation in terms of “organic certification”. Card “A” describes packed rice sold in the wet market. The rice package mentions the origin of the rice and the rice is certified (organic certification). Card “F” states that the rice is sold in bulk in the wet market in large bags. However, the rice bag mentions the country of origin and “organic certification.” Card “I” describes packed rice sold in minimarts. The rice package mentions the origin and that the rice has “organic certification”.
In Table 4 again, we compare the two scenarios “A” and “F”. If we change from scenario “A” to scenario “F”, 0.398 points of utility are lost relative to scenario “A”. This indicates that there is a loss of 5.5 %. This number was calculated based on the utility loss of scenario “F” (6.894) compared to the sum of utility in scenario “A” (7.292) for consumer preference regarding quality. The result shows that consumers prefer packed organic rice rather than unpacked organic rice when rice is sold in the wet market.
76In order to better understand consumer preferences regarding food quality, we changed the place of sale from a wet market to a minimart, unpacked and with the same organic certification, but with no indication of the country of origin (A over B). In this situation, we lose 1.097 points of utility relative to scenario “A”. This indicates that there is a loss of 15 % in consumer preference regarding quality. Wet markets are therefore more closely associated with quality rice than minimarts. However, consumer preference for scenario “A” over scenario “B” can be influenced by the country of origin because scenario “B” does not indicate the country of origin, whereas scenario “A” over “F” indicates the country of origin.
3.4. Cluster analysis
Using K-mean cluster analysis with the utility part-worth of each attribute, three clusters of consumers were identified. The P-value in table 5 shows that the retail outlet and organic certification attributes have strongly significant relationships among the three clusters of consumer (P-value <0.05), whereas the packaging and country of origin attributes have no significant effect among the three clusters. Demographic and economic characteristics of cluster households are presented in table 6.
The first cluster, “more educated households” comprises half of the respondents (151 consumers). It includes the highest number of interviewees who went at least to high school. The size of households is always lower than 7 members. It is the segment that attaches the greatest importance to organic certification to find rice of the desired quality.
Cluster 2 is “average-type households”. It comprises around a third of the consumers. It includes averagely educated and average-age consumers. Considering the positive part-worth utilities of this segment, these consumers assign a higher utility to the minimart then to the wet market and a low level to mobile vendors. Finally, the third cluster (20 % of consumers) is designated as “large households” It attaches considerable importance to organic certification, while the place of purchase (wet market) also has a positive part-worth utility. This consumer group has the highest percentage of people over the age of 45 and a large household size. This typology of clusters can serve for a segmentation of the market in terms of quality preferences.
77Tab. 5 – Means part-worth level of attributes
and relative importance by cluster.
Source: data analysis by the author, 2017.
|
Attributes and level |
Cluster |
ANOVA p-value |
||
|
1 (More educated household) |
2: Average-type household |
3: Large household |
||
|
(n=151; 51 %) |
(n=87; 29 %) |
(n=59; 20 %) |
||
|
Packaging |
||||
|
Unpacked |
0.232 |
0.048 |
0.334 |
0.123 |
|
Packed |
-0.232 |
-0.048 |
-0.334 |
0.123 |
|
Retail outlet |
||||
|
Wet market |
0.225 |
0.617 |
0.752 |
0.025 |
|
Minimart |
-0.336 |
1.648 |
-0.266 |
0.000 |
|
Mobile vendor |
0.111 |
-2.266 |
-0.486 |
0.000 |
|
Organic certification |
||||
|
Not indicated |
-1.09 |
0.375 |
-1.568 |
0.000 |
|
Indicated |
1.09 |
-0.375 |
1.568 |
0.000 |
|
Country origin |
||||
|
Not indicated |
-0.191 |
-0.378 |
-0.246 |
0.204 |
|
Indicated |
0.191 |
0.378 |
0.246 |
0.204 |
Tab. 6 – Main differences between clusters.
Source: survey, 2010.
|
Variables |
Sample |
Cluster 1: More educated household |
Cluster 2: Average-type household |
Cluster 3: Large household |
|
Gender iv |
||||
|
Men Women |
21 |
25 |
20 |
12 |
|
79 |
75 |
80 |
88 |
|
|
Age groupii |
||||
|
18-25 |
16 |
19 |
22 |
3 |
|
26-35 |
29 |
32 |
25 |
24 |
|
36-45 |
23 |
19 |
23 |
32 |
| 78
46-55 |
22 |
21 |
17 |
31 |
|
>55 |
11 |
10 |
13 |
10 |
|
Employment iv |
||||
|
Self-employed |
38 |
36 |
41 |
37 |
|
Housewives |
27 |
24 |
29 |
32 |
|
Government Unemployed |
21 |
24 |
21 |
15 |
|
5 |
7 |
3 |
3 |
|
|
Private employees |
6 |
8 |
- |
8 |
|
Other |
3 |
1 |
6 |
3 |
|
Educationii |
||||
|
Never been to school |
3 |
5 |
- |
2 |
|
Primary school/middle school |
34 |
26 |
41 |
46 |
|
High school |
23 |
21 |
21 |
29 |
|
Vocational/associate degree |
22 |
20 |
29 |
15 |
|
>=Bachelor |
19 |
28 |
9 |
8 |
|
Monthly income |
||||
|
<1 million |
10 |
10 |
11 |
10 |
|
1-3 million |
48 |
42 |
53 |
56 |
|
3.1-5 million |
21 |
21 |
21 |
22 |
|
5.1-7 million |
9 |
14 |
3 |
3 |
|
>7 million |
5 |
6 |
7 |
2 |
|
N/A |
6 |
7 |
5 |
7 |
|
Household size (no. of people)ii |
||||
|
1-3 |
16 |
26 |
9 |
0 |
|
4-7 |
62 |
74 |
74 |
17 |
|
>7 |
22 |
0 |
17 |
83 |
|
Children under 4 years oldi |
||||
|
No |
66 |
73 |
67 |
49 |
|
Yes |
34 |
27 |
33 |
51 |
|
People over 60 years old NS |
||||
|
No |
74 |
77 |
75 |
68 |
| 79
Yes |
26 |
23 |
25 |
32 |
|
Frequency of buying riceii |
||||
|
Several times a week |
18 |
13 |
25 |
20 |
|
Several times a month |
80 |
85 |
74 |
80 |
|
Once a month |
2 |
3 |
1 |
0 |
|
Knowledge of organic logoii |
||||
|
No |
53 |
50 |
48 |
68 |
|
Yes |
27 |
50 |
52 |
32 |
i. P <0.01
ii. P <0.05
iii. P <0.1
iv. non-significant
4. Discussion
The conjoint analysis found that the retail outlet (place of purchase) and organic certification has the largest relative importance in consumer perceptions of food quality, followed by the country of origin and packaging attributes. The indication of organic certification has a high positive utility, followed by wet market, minimart and indication of country of origin. The place of purchase attribute, especially wet markets and minimarts, has a positive influence on consumer confidence in rice quality, whereas the wet market shows a higher utility value (preference) than minimarts. This quantitative analysis is confirmed by the 2017 survey in which most consumers prefer to buy quality rice at the wet markets rather than in modern markets. This is conditioned by several aspects: first, the rice has not been stored for a long time. Second, it is not packaged, so that they can check some of its characteristics, especially its shape (long grain, unbroken rice is preferred). Third, they think that rice sold in wet markets contains no or limited chemicals compared to rice sold in supermarkets because it is produced in the Lao PDR without preservatives.
80The fact that wet markets are associated with fresher food has been highlighted by other studies, such as that of (Chamhuri and Batt, 2013). Therefore, wet markets have more advantages in terms of experience attributes for Laotian consumers. Supermarkets are not associated with higher food safety, in contrast to observations in other countries (Figuié and Moustier, 2009). We observe that minimarts and supermarkets in Lao PDR are still in their infancy and most consumers have not yet been exposed to them. Moreover, minimarts commonly sell rice imported from Thailand rather than local rice, so that uncertainty regarding production practices is high. Such rice has also been stored for a long time compared to local rice.
Conclusion
Summary of main results
This paper aims to assess the main factors that deliver a credible message to urban consumers in the Lao PDR concerning quality, with a focus on rice. From the literature review, we draw the hypothesis that food quality and safety are multi-dimensional and intertwined. Their perception by consumers is influenced by product origin (local being preferred), labelling, certification and the place of purchase. While these factors are often considered individually, we consider all four of them together with their interaction in the present study. The results show that retail outlets and organic certification have a major influence on consumer perceptions of quality. The preferred retail outlet is the wet market followed by minimarts (where rice may be stored for a long time) and then mobile vendors. We now come back to our hypotheses as follows:
H1 is confirmed: If rice is packaged, then quality is perceived to be higher
H2 is not confirmed except for average-type households: If rice is sold in the mini-mart, then quality is perceived to be higher
H3 is confirmed: If rice bears the label of being organically certified, then quality is perceived to be higher
81H4 is confirmed: If the origin is local, i.e. from Lao PDR, then quality is perceived to be higher
H5 is confirmed: If the different quality cues quoted before are combined, then quality is perceived to be higher.
Recommendations
First, it is recommended that public authorities support a diversity of distribution formats, including wet markets. As for minimarts, the number of which is growing rapidly3, we recommend that they consider selling local rice in bulk.
Second, certification and the indication of origin are keys to increasing consumer confidence in rice quality. Certification can be established at different levels and in different forms. It can either take the form of product certification, such as the promotion of production sites with a well reputed indication of origin, or certification of organic production. However, issuing quality signs is not enough to inform consumers. Consumers have difficulty in differentiating between organic labels and conventional labels and in understanding information on food certification (Roitner-Schobesbergeret al., 2008). Consumers’ trust in the agency responsible for issuing the signs is essential to guarantee the credibility of these signs. Government agencies and the private sector should increase consumer information on quality certification and labels. The study also provides some managerial implications in terms of recommending country-name branding.
Limitations of the study
First, the study design did not consider price as an attribute. Pricing impacts consumer perception of quality; for example, a higher price may be an indicator of higher quality of food from the consumer’s point of view.
Second, conjoint card design was created to depict regular consumer deals to get access to food. Consideration must therefore be given to the information on the card (picture) and whether the results may be biased.
82Another limitation is that the stimuli have been presented in the same order for all respondents.
Furthermore, the study only considered purchased rice and not rice obtained through gifts or self-production. Finally, the data was collected some years ago and it would be valuable to update it by means of a quantitative survey.
83References
Annunziata A., Vecchio R., 2013, “Consumer perception of functional foods: A conjoint analysis with probiotics”, Food Quality and Preference, vol. 28, no 1, p. 348-355.
Annunziata A., Vecchio R., 2016, “Organic Farming and Sustainability in Food Choices: An Analysis of Consumer Preference in Southern Italy”, Agriculture and Agricultural Science Procedia, vol. 8, p. 193-200.
Chamhuri N., Batt P.J., 2013, “Exploring the factors influencing consumers’ choice of retail store when purchasing fresh meat in Malaysia”, International Food and Agribusiness Management Review, vol. 16, no 3, p. 99-122.
Darby M.R., Karni E., 1973, “Free Competition and the Optimal Amount of Fraud”, The Journal of Law and Economics, vol. 16, no 1, p. 67-88.
Denver S., Jensen J.-D., 2014, “Consumer preferences for organically and locally produced apples”, Food Quality and Preference, vol. 31, p. 129-134.
Figuié M., Moustier P., 2009, “Market appeal in an emerging economy: Supermarkets and poor consumers in Vietnam”, Food Policy, vol. 34, no 2, p. 210-217.
Grolleau G., Caswell J., 2006, “Interaction between food attributes in markets: The case of environmental labeling”, Journal of Agricultural and Resource vol. 31, no 3, p. 471-484.
Grunert K.G., 2005, “Food quality and safety: consumer perception and demand”, European Review of Agricultural Economics, vol. 32, no 3, p. 369-391.
Grunert K.G., Loose S.M., Zhou Y., Tringgaard S., 2015, “Extrinsic and intrinsic quality cues in Chinese consumers’ purchase of pork ribs”, Food Quality and Preference, vol. 42, p. 37-47.
Gustafsson A., Herrmann A., Huber F.H.A., 2001, Conjoint measurement methods and applications, Springer, Berlin, New York.
Hempel C., Hamm U., 2016, “How important is local food to organic minded consumers?”, Appetite, vol. 96, p. 309-318.
Janssen M., Hamm U., 2012, “Product labelling in the market for organic food: Consumer preferences and willingness-to-pay for different organic certification logos”, Food Quality and Preference, vol. 25, no 1, p. 9-22.
Koutsimanis G., Getter K., Behe B., Harte J., Almenar E., 2012, “Influences of packaging attributes on consumer purchase decisions for fresh produce”, Appetite, vol. 59, no 2, p. 270-280.
Mergenthaler M., Weinberger K., Qaim M., 2009, “Consumer Valuation of Food Quality and Food Safety Attributes in Vietnam”, Applied Economic Perspectives and Policy, vol. 31, no 2, p. 266-283.
84Nelson P., 1970, “Information and Consumer Behavior”, Journal of Political Economy, vol. 78, no 2, p. 311-329.
Ophuis P.A.M.O., Trijp H.C.M.V., 1995, “Perceived quality: A market driven and consumer oriented approach”, Food Quality and Preference, vol. 6, no 3, p. 177-183.
Ortega D.L., Wang H.H., Wu L., Olynk N.J., 2011, “Modeling heterogeneity in consumer preferences for select food safety attributes in China”, Food Policy, vol. 36, no 2, p. 318-324.
Rijswijk W.V., Frewer L.J., 2008, “Consumer perceptions of food quality and safety and their relation to traceability”, British Food Journal, vol. 110, no 10, p. 1034-1046.
Roitner-Schobesberger B., Darnhofer I., Somsook S., Vogl C.R., 2008, “Consumer perceptions of organic foods in Bangkok, Thailand”, Food Policy, vol. 33, no 2, p. 112-121.
Šárka V., Giacomo D.C., 2015, “The Food Quality Labels: Awareness and Willingness to Pay in the Context of the Czech Republic”, Acta Universitatis Agriculturae et Silviculturae Mendelianae Brunensis, vol. 63, no 2, p. 647-658.
Strigler F., 2011, L’alimentation des Laotiens: Cuisine, recettes et traditions au Laos et en France, Karthala-CCL.
Tilman B., Eckhard B., Kristina G., 2000, “Consumer perception of fresh meat quality in Germany”, British Food Journal, vol. 102, no 3, p. 246-266.
Tsakiridou E., Mattas K., Tsakiridou H., Tsiamparli E., 2011, “Purchasing Fresh Produce on the Basis of Food Safety, Origin, and Traceability Labels”, Journal of Food Products Marketing, vol. 17, no 2-3, p. 211-226.
Uyttendaele M., Jacxsens L., Boxstael S.V., Kirezieva K., Luning P., 2015, Food safety standards in the fresh produce supply chain: advantages and disadvantages, in Sofos J. (ed.), Advances in Microbial Food Safety. Woodhead Publishing, Oxford, p. 379-405.
Wertheim Heck S.C.O., Spaargaren G., 2016, “Shifting configurations of shopping practices and food safety dynamics in Hanoi, Vietnam: a historical analysis”, Agriculture and Human Values, vol. 33, no 3, p. 655-671.
85Appendix 1
Stimuli used in conjoint analysis
|
|
Packaging: Packaged Retail outlets: Wet market Organic certification: Indicated Country of origin: Indicated |
|
|
Packaging: Unpackaged Retail outlets: Minimart Organic certification: Indicated Country of origin: Not indicated |
|
|
Packaging: Unpackaged Retail outlets: Mobile vendor Organic certification: Not indicated Country of origin: Indicated |
| 86
|
Packaging: Packaged Retail outlets: Wet market Organic certification: Not indicated Country of origin: Not indicated |
|
|
Packaging: Packaged Retail outlets: Mobile vendor Organic certification: Indicated Country of origin: Not indicated |
|
|
Packaging: Unpackaged Retail outlets: Wet market Organic certification: Indicated Country of origin: Indicated |
|
|
Packaging: Packaged Retail outlets: Minimart Organic certification: Not indicated Country of origin: Indicated |
| 87
|
Packaging: Unpackaged Retail outlets: Wet market Organic certification: Not indicated Country of origin: Not indicated |
|
|
Packaging: Packaged Retail outlets: Minimart Organic certification: Indicated Country of origin: Not indicated |
|
|
Packaging: Packaged Retail outlets: Mobile vendor Organic certification: Not indicated Country of origin: Indicated |
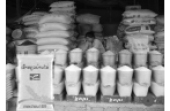


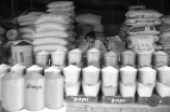
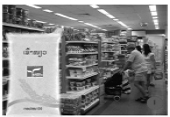

Source: All pictures were taken and drawn
by the team researcher of NUoL-FAO project, 2010.
1 Acknowledgements: The research presented was conducted in the framework of the NUoL-FAO project TCP/RAS/3209, entitled “Methodologies and tools for food consumer market research in Lao PDR.” The project was implemented by a team from the Department of Rural Economics and Food Technology, Faculty of Agriculture, National University of Laos, headed by Dr Silinthone Sacklokham, Assoc. Prof. Some methodological support was provided by Rian Beise-Zee (Al-Sulaiti & Baker), Nicolas Bricas (CIRAD), Muriel Figuié (CIRAD) and Jo Cadilhon (FAO).
2 The survey was part of a regional project covering four countries. There were several constraints in the other countries of the project which explain delays at various stages of data collection, processing and reporting; we conducted some focused additional surveys at the beginning of 2017 to confirm the validity of the 2010 survey (see 2.4).
3 The number of minimarts doubled between 2010 and 2016 according to officials in the Department of Industry in Vientiane interviewed in 2017; two supermarkets, selling a diversity of processed and food products and larger than 5,000 m² emerged in 2015.