Which Incentives for Direct Selling? An Analysis of French farms
- Publication type: Journal article
- Journal: Systèmes alimentaires / Food Systems
2017, n° 2. varia - Authors: Aubert (Magali), Enjolras (Geoffroy)
- Abstract: This article focuses on factors that encourage farmers to sell their production directly to consumers. Based on data from the Farm Accountancy Data Network 2006–2014, we establish profiles of direct selling farms. They are smaller and propose an increased range of produce compared to other farms. Beyond sectorial differences, their common feature is the use of fewer pesticides, which is consistent with the quality signal sent to consumers. Implications in terms of public policy are suggested.
- Pages: 115 to 141
- Journal: Food systems
- CLIL theme: 3306 -- SCIENCES ÉCONOMIQUES -- Économie de la mondialisation et du développement
- EAN: 9782406071969
- ISBN: 978-2-406-07196-9
- ISSN: 2555-0411
- DOI: 10.15122/isbn.978-2-406-07196-9.p.0115
- Publisher: Classiques Garnier
- Online publication: 11-17-2017
- Periodicity: Annual
- Language: English
- Keyword: Direct marketing, sustainable agriculture, agricultural accounting, France, panel data
Which incentives for direct selling?
An analysis of French farms1
Magali Aubert
INRA, UMR 1110 Moisa
Geoffroy Enjolras
FRE 3748 CERAG, Univ. Grenoble-Alpes
Introduction
In recent years, short food supply chains (SFSCs) have enjoyed renewed interests, from both practical and theoretical perspectives (Kneafsey et al., 2013). Their development fundamentally improves information on agricultural produce, a concern, which has become all the more important in the wake of food scandals that have weakened consumer confidence. Within SFSCs, any exchange should involve at most one clearly identified intermediary (Galli and Brunori, 2013). Without an intermediary, the sale is said to be ‘direct’, while it becomes ‘indirect’ as soon as an intermediary is involved (Agreste Primeur, 2012).
SFSCs, and among them direct selling, are usually attributed several virtues closely associated with the three pillars (social, environmental and economic) of sustainable development. At the social level, short food supply chains promote close relationships between producers and consumers that induce confidence. SFSCs are also associated to a lesser use of phytosanitary products (Aubert and Enjolras, 2016). Finally, in 116economic terms, both parties are supposed to find a mutual interest. The producer retains much of his added value thanks to the absence or limited number of intermediaries while the consumer is supposed to benefit from better-quality products sold at prices not too dissimilar from prices charged through long food supply chains (Martinez et al., 2010).
The development of SFSCs has been encouraged in most developed countries. At the European level, the second pillar of the Common Agricultural Policy encourages the development of SFSCs as a means of fostering rural development (Goodman et al., 2012). At the domestic level in France, the Ministry of Agriculture initiated an action in June 2009 aiming to develop direct sales. This effort was embodied in the article 230-1 of the Act No. 2010-874 dated July 27, 2010, relating to the modernization of agriculture and fishing. This law encourages actions relating to the “development of short food supply chains and […] geographical proximity between producers and processors”. France is the largest European producer of agricultural commodities in terms of acreage and production value (Eurostat, 2015). The country also plays the leading role with regard to the development of direct selling. In 2010, nearly 84,000 farmers (about one fifth) sold all or parts of their production through short food supply chains (Agreste Primeur, 2012). However, the study of the French context reveals some sectorial disparities regarding the level of activity and success factors (DRAAF Limousin, 2012).
Because of the interest shown in them, SFSCs have been the subject of many empirical contributions but very little attention has been paid to producers and the choices they make in favour of alternative food networks, and especially direct selling (Martinez et al., 2010). The few studies on this subject are qualitative, using small data volumes (Chiffoleau et al., 2013; Verhaegen and Van Huylenbroeck, 2001) or quantitative when a survey of agricultural farms can be used (Detre et al., 2011). The common point between these studies is that they restrict their analyses to the individual and structural parameters of farms incorporated within SFSCs. Consequently, several crucial points such as the performance or the sustainability of farms involved in short supply chains are not studied in sufficient detail (Blanquart et al., 2010).
In order to complement the existing literature on SFSCs and direct selling, the contribution provided by this paper is threefold. First, we 117propose an innovative analysis concerning the determinants of the adoption of direct selling as a marketing channel. The aim of this research is to demonstrate the existence of a typical profile of farmers, both on a global scale and with regard to agricultural specialization. Second, this analysis takes a specific account of financial and economic parameters in addition to structural ones. These aspects are likely to explain the level of farmers’ commitment to direct selling, because of the risks they take and the profitability they gain. Third, we use data from the French Farm Accountancy Data Network (FADN) for years 2006-2014 because they provide a representative overview of professional French farms, particularly in terms of productive orientation, as well as individual, structural and financial aspects of farms. They make it possible to differentiate producers who are involved in direct selling.
Our article is organized as follows. In the first part, we present the specific theoretical framework of our analysis, focusing on the determinants of direct selling as well as the resulting hypotheses. In the second part, we illustrate the empirical framework including the database used and the models estimated, while in the third part, we highlight some descriptive statistics and the econometric results in order to determine the parameters associated with the adoption of direct selling. In the fourth part, we conclude by presenting a summary of the factors encouraging farms to sell their products directly to consumers and suggest further perspectives to be explored in relation to this study.
1. Theoretical framework:
the determinants of direct selling
In this section, we develop the theoretical approach used in our study in order to determine factors associated with direct selling practices. The resource-based view appears as an appropriate framework to understand the practice of direct selling by farms. According to Penrose (1959), resources and capabilities within the firm can be developed in order to create external competitive advantages. This theoretical framework has 118been largely used to understand choices made in supply chain management (Halldorsson et al., 2007; Carter and Rogers, 2008).
Applied to our study, the general assumption made is that the more resources and skills the farm, and the farmer has the more they are able to adopt alternative marketing channels. This strategy thus aims to extend the farmers’ business capacity and outcome (Feenstra et al., 2003). The literature which is developing on the topic of short food supply chains and alternative food networks allows to define research hypotheses which provide an overview of the different keys allowing to understand the development of alternative marketing channels.
1.1. Level of activity of the farm
The activity of the farm indicates its production level and thereby its ability to adopt different marketing channels (Blanquart et al., 2010). The value of sales represents both a direct measure of the economic activity of the farm and an indicator of the physical dimension of the farm: the larger the farm, the higher its sales for a specific production. The positive influence of farm size has been emphasized in works highlighting the ability of large farms to adopt alternative marketing channels (Aubert and Perrier-Cornet, 2012). A high value of sales also motivates the farmer to adopt direct selling because he can retain most of the added value from his production (Chiffoleau et al., 2013).
H1a. Large and productive farms are more likely to adopt direct selling
Moreover, the European subsidies, which increase total farm revenues, provide the farm with larger financial resources, thus providing incentives for the adoption of alternative practices (Enjolras et al., 2014). More specifically, direct selling is supported within the second pillar of the Common Agricultural Policy. Measure 311 of the Rural Development Program for the 2007-2013 period promotes the “diversification into non-agricultural activities” whose main focus is to create alternatives on-farm employment opportunities in non-agricultural activities and services.
H1b. Subsidies increase the likelihood to adopt direct selling
1191.2. Financial assets of the farm
Insofar as direct selling is deemed complementary to traditional channels, only a farm with sufficient financial assets (Chiffoleau et al., 2013) and revenue (Aubert and Perrier-Cornet, 2009) can manage alternative marketing channels. The stock of financial assets includes fixed and current assets, which are the counterpart to the invested capital (equity and debt). Working capital is a structural indicator computed as the difference between current assets and current liabilities.
H2a. Long-term financial assets increase the likelihood to adopt direct selling
The working capital requirement is more a seasonal indicator, which characterizes the money needed by the farmer to finance delayed customer invoices and stocks. Direct selling is supposed to provide increasing cash flows, and therefore decrease the working capital requirement, thanks to the one-to-one relationship between farmers and consumers. However, this effect may be offset by increasing stocks the farmer must set aside to satisfy his customers’ needs in terms of produce diversity.
H2b. Short-term financial assets increase the likelihood to adopt direct selling
1.3. Profitability and financial risk of the farm
One of the basic aims of a farm is to maximize the value of sales and thereby its profitability and alternative marketing channels may contribute to this objective (Ahearn and Sterns, 2013). Conversely, farmers adopting traditional marketing channels and observing low or negative profitability of their business may also be incited to change their marketing channels, thus adopting direct selling (Conner et al., 2010; Praly, 2010).
H3a. Unprofitable farms are more likely to adopt direct selling
The adoption of alternative marketing channels can also be examined through the financial risk of the farm, i.e. the risk associated with its indebtedness (Ahearn and Sterns, 2013). Indebted farms need to generate enough cash to payback both debt and interests. Because selling produces directly to consumers offers a convenient way to generate cash flows, indebted farms may be incited to adopt alternative marketing channels.
120H3b. Indebted farms are more likely to adopt direct selling
1.4. Farm risk management
The adoption of alternative marketing channels responds to consumers’ demand for alternative agricultural products (Lanciano and Saleilles, 2010). Consequently, this strategy offers the farmer an opportunity to reach more customers compared to standard food supply chains in which the farmer trades with a small number of partners. In return, the farmer faces uncertainty in terms of the volume sold. Farmers may choose to diversify, particularly by exercising several activities within the farm such as mixed crop and livestock production. Diversification is then measured through the number of different types of production on the farm.
H4a. Diversified farms are more likely to adopt direct selling
We can also assume that the concerned farmers are looking for direct ways to protect their production against the risks, which traditionally affect crops (e.g. diseases, adverse climate). Several means are available, such as crop insurance policies that help to secure economic yields (Enjolras and Sentis, 2011). However, insurance policies are quite costly. Phytosanitary products (fertilizers or pesticides) may be used as flexible and quite cheap tools for the preservation of crop yields. However, excessive use would be at odds with the quality image conveyed by short food supply chains (Ilberry and Maye, 2005; Verhaegen and Van Huylenbroeck, 2001).
H4b. The purchase of insurance policies and phytosanitary products decreases the likelihood to adopt direct selling
1.5. Skills available on the farm
Beyond the level of activity, individual skills within the farm are key factors in explaining the adoption of alternative marketing channels. It is widely acknowledged that direct selling requires additional workforce in order to perform both productive and commercial activities on the farm (Chiffoleau et al., 2013; Galli and Brunori, 2013). Some authors showed that some favourable conditions, such as increased workforce, 121were a prerequisite to the development of new activities on the farm (Aubert et Perrier-Cornet, 2012).
H5a. An increased workforce increases the likelihood to adopt direct selling
More educated and experienced farmers seem more able to sell their own production because they can manage the different aspects of short food supply chains, including the production, transformation and commercialization processes (Chiffoleau et al., 2013; Gilg and Battershill, 1999). Alternative marketing channels, including the adoption of direct selling, requires more labour (Lanciano and Saleilles, 2010) and more specifically a waged and qualified workforce (Aubert and Perrier-Cornet, 2012).
H5b. Educated and experienced farmers are more likely to adopt direct selling
1.6. Proximity between farmers and consumers
The farm location appears as a key factor in the adoption of alternative marketing channels. Some studies especially consider the spatial proximity between farmers and consumers (Capt, 1994; Capt and Schmitt, 2000; Low and Vogel, 2011), while others also take into account the number of intermediaries between farmers and consumers (Martinez et al., 2010). Jarosz (2008) specifies that alternative food networks are characterized by the existence of retail venues such as local markets, community supported agriculture and a commitment to sustainable food production and consumption.
H6. A farm location close to consumers increases the likelihood to adopt direct selling
2. Empirical framework
In this section, we present the specific database used and its importance in understanding farmers’ motivations. We also illustrate the econometric model to be estimated.
1222.1. Database
In order to examine the characteristics of farms involved in direct selling, we use data from the European Farm Accountancy Data Network (FADN) for the period 2006–2014. These data are both the most precise available at the individual level, and the most complete and recent that we have. They allow examine closely the structural features of the farm and the individual characteristics of the owner.
One of the major advantages of our database is that it allows us to identify the intensity of direct selling using a ternary variable. This variable distinguishes farms that do not sell through direct selling from farms that adopt such a practice. The latter are differentiated according to whether this marketing channel represents more or less than 75% of the value of sales (Figure 1). In general, farms involved in direct selling do not consider this marketing strategy as an exclusive channel. One should note that the FADN database allows examine the adoption of direct selling at the farm level, but without mentioning the first year of adoption.
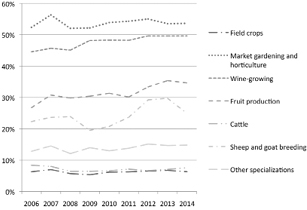
Fig. 1 – Distribution of farms according to the marketing channel in 2014. Source: French FADN 2006-2014.
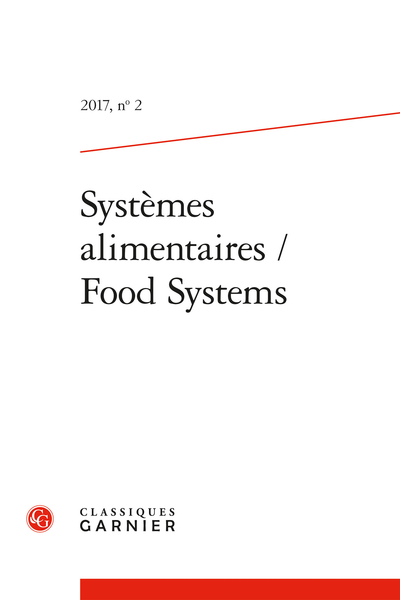
123Our analysis considers the determinants of direct selling at the global level for all professional farms regardless of their activities and for the farms’ main specializations. Market gardeners, wine growers, fruit producers as well as sheep and goat breeders are more involved in short supply chains. For these specializations and whatever period considered, one to three farmers out of five sell through this marketing channel while they are less than one in ten for the other specializations (Figure 2).
|
Field crops |
Market gardening |
Wine growing |
Fruit production |
Sheep and goat breeding |
Cattle breeding |
Other specializations |
All |
|
|
No direct selling |
93.72% |
46.36% |
50.36% |
65.36% |
75.08% |
92.44% |
85.20% |
81.62% |
|
Direct Selling |
6.28% |
53.64% |
49.64% |
34.64% |
24.92% |
7.56% |
14.80% |
18.38% |
|
<75% |
5.69% |
25.15% |
32.21% |
18.16% |
13.89% |
6.89% |
11.62% |
12.69% |
|
>75% |
0.60% |
28.49% |
17.42% |
16.48% |
11.03% |
0.66% |
3.19% |
5.69% |
Fig. 2 – Dynamics of direct selling according to the economic
and technical orientation. Source: French FADN 2014.
The distribution of farms adopting direct selling shows the importance of wine growing involved in this marketing channel (Figure 3). An explanation can be found in the specific characteristics of the concerned productions. Winemaking is a long-term process, which requires a high level of investment (e.g. cellars, maceration vats and presses). Producers are very often involved in cooperatives, leading to higher integration of marketing channels (Traversac et al., 2011). Fruit production, market gardening and cattle breeding are perishable productions, which face somehow the same financial challenges, while experiencing difficulties related to volatile weather conditions or drop in prices. Therefore, direct selling constitutes a credible alternative to conventional marketing channels.
124
Fig. 3 – Distribution of farms, which adopted direct selling in 2014.
Source: French FADN 2014.
2.2 Econometric models
The aim of our study is to understand what is the individual, structural and financial characteristics that lead to a higher probability to sell directly to consumers. To do so and take into account the individual and temporal dimensions associated with direct selling, we estimate a multinomial logit model. This cross-section model allows us to appreciate the intensity of the adoption of direct selling. The model is specified with clusters in order to underline that a same farmer can be present from one year to the next. Such an approach is more suitable than a panel data analysis given the fact that farms adopting direct selling stay involved in this marketing channel overtime (Figure 1).
Formally, the model considered can be defined as follows:
|
Direct selling = ∝ + β *Activity+ γ *Skills+ δ *Financial assets |
|
|
+ θ *Profitability and risks + ξ *Risk management + ρ *ETO |
(1) |
|
+ τ *Year + ε |
Where α represents the constant, β, γ, δ, θ, ξ, ρ and τ the coefficients associated with each group of variables and ε the residuals.
125We summarize the model (1) as follows:
|
Y=X ’ ρ + μ |
(2) |
Where Y corresponds to the practice of direct selling detailed above. The adoption of direct selling is a ternary variable, which takes the value 0 if the farmer does not sell through this marketing channel, 1 if this activity represents less than 75% of its sales and 2 otherwise. This choice is conditioned by a continuous effect that is not observed.
This decision is modelled as shown below:
|
Y=0 if Y*< ξ |
|
|
Y=1 if ξ <Y*< ζ |
(3) |
|
Y=2 if Y*> ζ |
Where Y* is the latent variable that conditions the decision to adopt direct selling (Y).
As stated previously, farms specializing in field crops, market gardening, wine-growing, fruit production, sheep and goat breeding, as well as cattle breeding are those which are most likely to adopt the practice of direct selling. Thus, we consider seven different models: the first is general and encompasses all French professional farms, while the other models consider each specialization separately. It should be noted that, to avoid endogeneity problems, financial variables are lagged by one year. Similarly, potential size effects are neutralized for financial variables, e.g. the amounts in euros are divided by total farm sales.
3. Results
In this section, we present the results of the descriptive statistics and the econometric model which enable us to understand the factors associated with the adoption of direct selling by farmers. Among farms that adopted direct selling, we separate those that are very involved into this marketing channel (more than 75% of sales) and those that are less involved (less than 75% of sales).
1263.1. Descriptive statistics
Farmers who adopted direct selling in 2014 seem to declare a higher value of sales than other farms (Figure 4). The explanation may lie in the fact that farmers involved in short food supply chains have the ability to determine selling prices by themselves. Moreover, farmers who adopted direct selling appear to receive fewer subsidies than those who sold their entire production through another channel. Such a result may indicate that overall subsidies are not enough of an incentive to promote the adoption of direct selling.
|
No direct selling |
Direct selling |
||||
|
Less than 75% |
More than 75% |
||||
|
Values |
Values |
Test |
Values |
Test |
|
|
Sales |
197,864.00 |
241,478.00 |
*** |
247,877.00 |
** |
|
Operating subsidies / Sales |
0.28 |
0.17 |
*** |
0.11 |
*** |
|
Wages / Sales |
0.13 |
0.18 |
*** |
0.22 |
*** |
|
Waged workforce / Total workforce (%) |
12.46 |
28.94 |
*** |
35.77 |
*** |
|
Total workforce |
1.87 |
2.87 |
*** |
3.50 |
*** |
|
Financial leverage (%) |
41.29 |
40.85 |
ns |
44.65 |
ns |
|
Working capital |
−1,391.96 |
1,064.74 |
ns |
10,048.70 |
** |
|
Working capital requirement |
89,750.40 |
181,251.00 |
*** |
193,275.00 |
*** |
|
Capital accumulation |
−1,735.31 |
2,905.27 |
* |
5,854.66 |
* |
|
Fixed assets |
271,389.20 |
265,680.10 |
ns |
227,730.10 |
** |
|
Current assets |
155,407.70 |
265,808.60 |
*** |
306,852.00 |
*** |
|
Return on capital employed |
0.11 |
0.13 |
ns |
0.16 |
*** |
|
Financial result |
−4,247.72 |
−4,839.07 |
* |
−4,390.06 |
ns |
|
Self-financing |
26,906.90 |
30,050.10 |
ns |
32,730.40 |
ns |
|
Cash-flows |
67,471.20 |
75,664.60 |
** |
78,047.70 |
ns |
|
Be insured |
0.52 |
0.44 |
*** |
0.34 |
*** |
|
Fertilizer expenses / Sales |
0.09 |
0.04 |
*** |
0.02 |
*** |
| 127
Pesticide expenses / Sales |
0.07 |
0.04 |
*** |
0.03 |
*** |
|
Number of different productions |
2.26 |
2.18 |
* |
1.74 |
*** |
Keys: The null hypothesis considers equality of means between the population and the reference “No direct selling”. Means are significantly different at the 10% (*), 5% (**) and 1% (***) thresholds.
Fig. 4 – Farm characteristics according to the marketing channel.
Source: French FADN 2014.
Direct selling requires fewer investments, but this is compensated with higher current assets. We notice currently a significantly higher return on capital employed and higher working capital only for farm highly involved in di179
rect selling. Moreover, farms which are more weakly involved in direct selling benefit from slightly higher cash-flow levels compared to farms not involved in this marketing channel.
We also observe that the return on capital employed is higher for farms highly involved in direct selling. All these results seem to indicate that direct selling is associated with profitability. Moreover, direct selling farms do not get more indebted compared to other farms and they pay on average the same amount of interest. Direct selling is therefore not associated with a higher financial risk.
Farmers who adopted direct selling seem to offer a smaller range of products to their customers. However, we notice an increased value of stocks, which is necessary to meet the customers’ demand2. Consequently, the working capital requirement of their farm is significantly higher. This last indicator is almost doubled when compared to farms that did not practice direct selling. Such a stock level requires consistent financing, which is not offset by the fact that customers pay for their purchases in cash.
Because they are associated with higher investment, products sold directly to consumers have to be covered upstream at the time of production. However, the profile of these farmers denotes an orientation 128towards risk. Firstly, they seem to decrease their insurance. Secondly, they spend smaller amounts of fertilizers and pesticides. These are in line with the image of quality associated with direct selling.
Finally, the literature points skills as a key element in the adoption of direct selling (Figure 5). We note that farmers who adopted direct selling seem to be younger and benefit from a higher level of education, both in terms of agricultural and general education. These elements appear to confirm the literature, which asserts that younger and better-educated farmers are more likely to adopt direct selling.
|
No direct selling |
Direct selling |
||||
|
Less than 75% |
More than 75% |
||||
|
Proportion |
Proportion |
Test of equality of proportions |
Proportion |
Test of equality of proportions |
|
|
No agricultural education |
20.99% |
22.10% |
19.65% |
** |
|
|
Agricultural primary education |
45.14% |
42.43% |
35.69% |
||
|
Agricultural secondary education |
25.07% |
25.86% |
31.68% |
||
|
Agricultural higher education |
8.80% |
9.61% |
12.98% |
||
|
No general education |
19.35% |
16.73% |
*** |
13.05% |
*** |
|
General primary education |
54.42% |
50.86% |
51.67% |
||
|
General secondary education |
23.60% |
27.23% |
28.71% |
||
|
General higher education |
2.63% |
5.18% |
6.57% |
||
|
Age <35 years |
6.88% |
7.92% |
** |
7.97% |
|
|
Age 35–45 years |
21.62% |
26.74% |
21.11% |
||
|
Age 45–55 years |
41.24% |
35.88% |
38.63% |
||
|
Age >55 years |
30.26% |
29.46% |
32.29% |
||
Keys: The null hypothesis considers equality of proportions between the population and the reference “No direct selling”. Proportions are significantly different at the 10% (*), 5% (**) and 1% (***) thresholds.
Fig. 5 – Farmer’s characteristics according to the marketing channel.
Source: French FADN 2014.
Direct selling is associated with an increased workforce working on the farm. Additional waged labour is required because of the various skills needed at the different stages of the productive process, e.g. production, processing and marketing. This workforce represents an additional operating cost, which increases according to the share of the farm’s production sold through this marketing channel.
3.2. Econometric models
We complement these descriptive statistics by econometric models that explain the adoption of direct selling practices considering the main kinds of variables exposed earlier. The results are presented in Figure 6 in the appendix.
Before considering the main specializations, the global model highlights two main results. The first one is the existence of some specificities among specializations in terms of marketing strategy. The probability of selling directly to consumers is greater for farms specializing in market gardening, wine-growing and fruit production, while the lesser for farms specializing in cattle breeding, compared to farms specializing in field crops (the reference). Indeed, specific produces, such as fruits and wine, are more suitable for direct selling than generic ones, such as cereals. The second one is that the degree of involvement in direct selling (percentage of sales) does not fundamentally change the nature and the extent of the results. Once adopted, direct selling leads to the adoption of a specific pattern.
In terms of the level of activity, it appears that the value of sales is an important decisive factor for the adoption of direct selling. The global model shows that the smallest farms are more likely to adopt this marketing channel. These farms may adopt direct selling as a convenient way to sell a small production. On the other side of the spectrum, a high level of activity may also incite farms to get very involved in direct selling, probably because of the largest range of produces they can offer to consumers. We observe an opposite situation among wine-growing farms, probably because of the specificities of this specialization. H1a is mostly validated. Furthermore, we find that the level of operating subsidies does not condition direct selling. Except for cattle breeding, subsidies do not seem to provide enough 130of an incentive to help producers adopt this marketing channel. H1b is not validated.
For cattle breeding, market gardening and field crops, capital accumulation lead to increased likelihood to adopt widely direct selling. This result suggests that farms, which reinforce their productive activity, are able to adopt alternative marketing channels, thus bringing some validity to this hypothesis. We also notice that fixed assets do not determine the adoption of direct selling. H2a is partially validated. Consequently, direct selling farmers seem to have to find short-term resources to carry out their marketing and sales activities. The study of the financial situation of farm shows that, for all professional farms, the working capital requirement plays a significant and positive role in the adoption of direct selling in the global model. Availability of stocks thus appears to be decisive. However, for wine-growers and cattle breeders very involved in this marketing channel, an opposite effect is noticed. These farmers may find in traditional marketing channels the most convenient way to sell their products. H2b is also partially validated.
Except for farms specializing in field crops and wine-growing, the model highlights that the return on capital employed has no impact on direct selling. This result demonstrates that a higher level of return does not specially motivate farmers that adopt direct selling. Except for field crops, the indebtedness level and interest paid do not influence the choice of a marketing channel. Self-financing, however, has a negative influence on direct selling for field crops and wine-growing sectors, and a positive influence for sheep and goat breeding. The ability to use internal resources provides a disincentive to adopt alternative marketing channels for farmers in the former group while it is the opposite of the latter. H3a and H3b are therefore not validated.
Direct selling producers are more diversified than farmers who sell through traditional channels because they have to meet consumer demand in terms of produce diversity, which validates H4a. Irrespective of the production, subscribing crop insurance policies has generally no impact on the farmer’s marketing strategy. Conversely, most models highlight the fact that increased expenses of pesticides and fertilizers lead to a lower probability of selling directly to consumers. This very significant result confirms the image of quality associated with products sold using short food supply chains. Thus, H4b is partially validated.
131Contrary to what the descriptive statistics suggested, the study of the farmers’ skills reveals that their age is generally not decisive in the choice to sell any part of their production directly to consumers. The level of agricultural and general education does not seem to be relevant either. The relative weight of the waged workforce in the total workforce has a contrasted influence on the decision to sell directly to consumers. H5a and H5b are not validated.
Because of its characteristics, the FADN database allows analyze only the farm and its owner’s characteristics (hypotheses H1a to H5b). Therefore, one of the main dimensions associated to direct selling, the proximity between farmers and consumers, could not be taken into account in our analysis. H6 was not testable.
Conclusion
In this article, we have proposed a study of economic and financial factors encouraging farmers to sell their production directly to consumers. This analysis is intended to complement a literature that traditionally focuses on the analysis of the individual or structural determinants of the adoption of direct selling. Moreover, with FADN data we considered the main sectors in which farmers are most commonly engaged in direct selling.
One salient result of this study is to highlight key features of French farms and farmers practising direct selling, despite differences in production. In general, these farmers appear to operate on smaller farms, and this small size is an incentive to adopt such a marketing channel. Direct selling implies the mobilization of a set of human (labour) and financial resources (working capital requirement and current assets) in order to face the short-term challenges of this marketing channel. These farms are then able to offer an increased range of products to meet consumers’ expectations. Such diversification is indeed a strong prerequisite to direct selling. By contrast, direct selling farms do not need a large amount of fixed assets to operate, which results in lightweight financial and operating structures.
132This comprehensive knowledge of direct selling allows us to discuss the implications in terms of public policy. Our analysis underlines that farmers practising direct selling are more respectful of the environment, which results in reduced expenses of chemical inputs (fertilizers and pesticides) for almost all productions considered. It therefore appears relevant for a farmer to adopt direct selling with an ecological objective, and vice versa.
Future research should confirm these results by studying in more detail the dynamics of direct selling. We could notice that many farms belonging to our database have adopted direct selling for years. Given these aspects, an interesting question would be to understand if this adoption is temporary or permanent, and in all cases which kinds of producing patterns are adopted.
133Appendix
|
All |
Field crops |
Market gardening |
Wine growing |
Fruit production |
Cattle breeding |
Sheep and goat breeding |
||||
|
Less than 75% of sales |
||||||||||
|
Sales−1 |
−0.000*** |
−0.000 |
−0.000 |
0.000*** |
0.000 |
−0.000 |
−0.000 |
|||
|
Square Sales−1 |
0.000 |
0.000 |
0.000 |
−0.000** |
−0.000 |
0.000 |
0.000 |
|||
|
Fertilizers expenses / Sales−1 |
−5.217*** |
−1.033 |
5.559* |
−30.703*** |
−9.760 |
−7.680** |
−16.141*** |
|||
|
Pesticides expenses / Sales−1 |
−8.179*** |
−12.044*** |
−11.984** |
−10.187*** |
−2.997 |
−11.600 |
−3.865 |
|||
|
Operating subsidies / Sales−1 |
−0.240 |
−0.611 |
−0.722 |
−0.205 |
−0.391 |
1.058* |
0.649 |
|||
|
Financial leverage−1 |
−0.001 |
0.002 |
0.001 |
−0.006 |
−0.005 |
0.003 |
−0.006 |
|||
|
Wages / Sales−1 |
0.733 |
4.652* |
1.784 |
0.375 |
0.513 |
8.615** |
−5.569 |
|||
|
Square Wages / Sales−1 |
−0.038 |
−4.401 |
−3.837 |
0.025*** |
0.005 |
−19.701* |
−1.349 |
|||
|
Waged workforce / |
0.011*** |
0.015** |
−0.004 |
0.002 |
0.008 |
0.010* |
0.005 |
|||
|
Age (Reference: Age <35 years) |
||||||||||
|
Age 35–45 years |
−0.040 |
−0.333 |
0.489 |
0.109 |
0.344 |
−0.338 |
−0.040 |
|||
|
Age 45–55 years |
−0.203 |
−0.398 |
0.147 |
−0.308 |
0.341 |
−0.398 |
−0.084 |
|||
|
Age >55 years |
−0.209 |
−0.487 |
0.510 |
−0.327 |
0.182 |
−0.597* |
0.194 |
|||
|
General education (Reference: No general education) |
||||||||||
|
General primary education |
0.120 |
0.474 |
−0.644 |
0.477 |
0.218 |
−0.411 |
0.286 |
|||
|
General secondary education |
0.108 |
0.030 |
−0.328 |
0.856** |
0.410 |
−0.169 |
−0.299 |
|||
|
General higher education |
0.305 |
0.548 |
0.198 |
0.136 |
2.099** |
−0.556 |
1.950* |
|||
|
Keys: Estimates significant at the 10% (*), 5% (**) and 1% (***) thresholds, −1 denotes a lagged variable. Fig. 6 – Econometric models explaining direct selling. Source: French FADN 2006–2014. |
||||||||||
|
All |
Field crops |
Market gardening |
Wine growing |
Fruit production |
Cattle breeding |
Sheep and goat breeding |
||||
|
Less than 75% of sales |
||||||||||
|
Agricultural education (Reference: No agricultural education) |
||||||||||
|
Agricultural primary education |
−0.305* |
−0.571* |
0.115 |
−0.633* |
0.055 |
−0.322 |
0.200 |
|||
|
Agricultural secondary education |
−0.213 |
−0.245 |
0.449 |
−0.438 |
−0.040 |
−0.426 |
0.496 |
|||
|
Agricultural higher education |
−0.204 |
−0.376 |
0.335 |
−0.576 |
−0.117 |
−0.932** |
0.499 |
|||
|
Working capital−1 |
−0.000* |
−0.000 |
−0.000 |
0.000** |
0.000 |
0.000 |
−0.000 |
|||
|
Working capital requirement−1 |
0.000*** |
0.000 |
0.000 |
−0.000 |
−0.000 |
0.000 |
0.000 |
|||
|
Capital accumulation / Sales−1 |
0.065 |
−0.138 |
0.434 |
−0.022 |
0.400 |
0.187* |
0.026 |
|||
|
Fixed assets / Sales−1 |
0.009 |
0.134 |
−0.040 |
−0.051 |
0.087 |
−0.079 |
−0.031 |
|||
|
Current assets / Sales−1 |
0.137 |
−0.213 |
0.062 |
0.541*** |
−0.044 |
−0.259 |
−0.149 |
|||
|
Return on capital employed−1 |
−0.030 |
0.221 |
−0.229 |
−2.353*** |
−0.270 |
−1.704 |
2.385 |
|||
|
Financial result−1 |
−0.000 |
0.000* |
0.000 |
0.000 |
0.000 |
−0.000 |
−0.000 |
|||
|
Being insured−1 |
−0.062 |
0.196 |
0.442 |
−0.256 |
−0.494 |
−0.270 |
0.008 |
|||
|
Number of different productions |
0.325*** |
0.920*** |
−0.018 |
0.531*** |
0.321* |
0.866*** |
0.376 |
|||
|
Self-financing−1 |
−0.000 |
−0.000*** |
0.000 |
−0.000** |
0.000 |
0.000 |
0.000 |
|||
|
Cash-flows |
−0.000** |
0.000 |
−0.000 |
−0.000 |
−0.000 |
0.000 |
0.000 |
|||
| 135
Economic and Technical Orientation (Reference: Field crops) |
||||||||||
|
Market gardening |
1.221*** |
|||||||||
|
Wine growing |
1.063*** |
|||||||||
|
Fruit production |
0.587* |
|||||||||
|
Cattle breeding |
−0.786*** |
|||||||||
|
Sheep and goat breeding |
0.164 |
|||||||||
|
Other specializations |
0.083 |
|||||||||
|
Year (Reference: 2006) |
||||||||||
|
2007 |
−0.050 |
−0.117 |
0.167 |
−0.514** |
0.055 |
−0.412 |
−0.684 |
|||
|
2008 |
0.000 |
−0.134 |
0.120 |
−0.489** |
0.185 |
−0.481 |
−0.455 |
|||
|
2009 |
1.214*** |
−0.168 |
0.050 |
−0.115 |
0.329 |
−0.315* |
−0.321 |
|||
|
2010 |
0.945*** |
−0.011 |
0.122 |
−0.137 |
0.240 |
−0.036 |
−0.392 |
|||
|
2011 |
0.494* |
−0.082 |
−0.009 |
−0.352* |
−0.024 |
−0.057 |
−0.528 |
|||
|
2012 |
−0.967*** |
−0.036 |
0.250 |
−0.206 |
0.142 |
−0.263* |
−0.541 |
|||
|
2013 |
−0.328 |
0.022 |
0.233 |
−0.079 |
0.302* |
−0.120 |
−0.537 |
|||
|
2014 |
−0.367* |
0.000 |
0.000 |
0.000 |
0.000 |
0.000 |
0.000 |
|||
|
Intercept |
−1.467*** |
−3.515*** |
−0.255 |
−0.759 |
−1.973* |
−3.622*** |
−1.175 |
|||
|
Keys: Estimates significant at the 10% (*), 5% (**) and 1% (***) thresholds, −1 denotes a lagged variable. Fig. 6 – Econometric models explaining direct selling. Source: French FADN 2006–2014 (continued). |
||||||||||
|
All |
Field crops |
Market gardening |
Wine growing |
Fruit production |
Cattle breeding |
Sheep and goat breeding |
|
|
More than 75% of sales |
|||||||
|
Sales−1 |
−0.000** |
−0.000 |
−0.000 |
0.000*** |
−0.000 |
−0.000 |
−0.000* |
|
Square Sales−1 |
0.000** |
0.000 |
0.000 |
−0.000 |
0.000 |
0.000 |
0.000 |
|
Fertilizers expenses / Sales−1 |
−10.163** |
−1.905 |
7.692* |
−41.051*** |
−24.061*** |
−9.132 |
2.753 |
|
Pesticides expenses / Sales−1 |
−14.229** |
−15.173* |
−29.116*** |
−18.692*** |
−2.090 |
−12.563 |
−84.486* |
|
Operating subsidies / Sales−1 |
−0.420 |
−0.651 |
−2.550 |
1.064 |
−2.012 |
1.509** |
−0.854 |
|
Financial leverage−1 |
−0.001 |
−0.021* |
−0.005 |
0.004 |
0.002 |
−0.025 |
−0.011 |
|
Wages / Sales−1 |
1.563 |
1.396 |
5.740 |
−1.671** |
−1.079 |
13.649* |
18.795*** |
|
Square Wages / Sales−1 |
−0.078 |
−4.049 |
−7.763* |
0.058*** |
0.034 |
−21.566 |
−29.694*** |
|
Waged workforce / |
0.009* |
0.023* |
−0.010 |
0.008 |
−0.004 |
0.004 |
0.035** |
|
Age (Reference: Age <35 years) |
|||||||
|
Age 35–45 years |
0.164 |
−0.649 |
0.272 |
0.097 |
1.588* |
0.255 |
1.518* |
|
Age 45–55 years |
−0.004 |
−0.743 |
−0.156 |
−0.024 |
0.803 |
0.734 |
1.390 |
|
Age >55 years |
0.048 |
−1.509* |
0.070 |
−0.106 |
0.936 |
0.528 |
1.576 |
|
General education (Reference: No general education) |
|||||||
|
General primary education |
0.015 |
−0.058 |
0.654 |
0.455 |
1.132 |
−0.629 |
−1.140 |
|
General secondary education |
−0.206 |
−0.028 |
0.167 |
1.124** |
1.376 |
−0.392 |
−2.895** |
|
General higher education |
0.342 |
0.133 |
0.748 |
1.080 |
0.861 |
−0.053 |
−0.604 |
|
Agricultural education (Reference: No agricultural education) |
|||||||
|
Agricultural primary education |
0.069 |
−0.116 |
0.506 |
−0.235 |
−0.885 |
0.592 |
0.564 |
| 137
Agricultural secondary education |
0.602 |
0.198 |
0.753 |
0.109 |
−0.889 |
0.306 |
2.152** |
|
Agricultural higher education |
0.501 |
0.313 |
0.468 |
−0.399 |
0.948 |
0.622 |
2.314** |
|
Working capital−1 |
−0.000*** |
0.000** |
−0.000 |
0.000 |
−0.000 |
0.000 |
−0.000 |
|
Working capital requirement−1 |
0.000*** |
−0.000 |
−0.000 |
−0.000** |
0.000 |
−0.000* |
0.000 |
|
Capital accumulation−1 |
−0.114 |
0.563** |
0.766* |
−0.076 |
−0.492 |
0.402** |
0.171 |
|
Fixed assets / Sales−1 |
0.050 |
−0.167 |
−0.108 |
0.027 |
0.329 |
−0.203 |
−0.223 |
|
Current assets / Sales−1 |
0.028 |
−1.469** |
−0.447 |
0.829*** |
−0.432 |
−0.769 |
−2.161*** |
|
Return on capital employed−1 |
0.508 |
0.768* |
0.082 |
−1.043 |
−0.730 |
−2.708 |
−1.136 |
|
Financial result−1 |
−0.000 |
0.000 |
−0.000 |
0.000 |
−0.000 |
−0.000 |
0.000 |
|
Being insured−1 |
−0.037 |
−0.202 |
0.545 |
−0.008 |
0.409 |
0.255 |
−1.979* |
|
Number of different productions |
−0.013 |
0.666* |
−0.234 |
0.672*** |
0.263 |
0.549 |
−0.321* |
|
Self-financing−1 |
−0.000 |
−0.000* |
−0.000 |
−0.000** |
−0.000 |
0.000 |
0.000*** |
|
Cash-flows |
−0.000 |
−0.000 |
−0.000 |
−0.000 |
0.000 |
−0.000 |
0.000 |
|
Economic and Technical Orientation (Reference: Field crops) |
|||||||
|
Market gardening |
1.738*** |
||||||
|
Wine growing |
1.235*** |
||||||
|
Keys: Estimates significant at the 10% (*), 5% (**) and 1% (***) thresholds, −1 denotes a lagged variable. Fig. 6 – Econometric models explaining direct selling. Source: French FADN 2006–2014 (continued). |
|||||||
| 138
Fruit production |
0.833* |
||||||
|
Cattle breeding |
−1.819*** |
||||||
|
Sheep and goat breeding |
0.871 |
||||||
|
Other specializations |
−.0114 |
||||||
|
Year (Reference: 2006) |
|||||||
|
2007 |
−0.158*** |
1.113* |
−0.037 |
−0.326 |
−0.517 |
0.267 |
0.940 |
|
2008 |
0.000 |
0.083 |
0.054 |
−0.186 |
−0.813* |
0.561 |
0.303 |
|
2009 |
1.661*** |
−0.332 |
−0.239 |
0.052 |
−0.506 |
0.469 |
−0.174 |
|
2010 |
1.207*** |
−0.341 |
0.081 |
0.265 |
−0.294 |
0.384 |
0.134 |
|
2011 |
0.889* |
−0.511 |
0.127 |
−0.121 |
−0.782** |
0.000 |
−0.034 |
|
2012 |
−2.024*** |
−0.580* |
0.124 |
−0.187 |
−0.423 |
−0.461 |
0.389 |
|
2013 |
0.824 |
−0.311 |
−0.024 |
−0.195* |
−0.220 |
−0.250 |
0.144 |
|
2014 |
−0.100 |
0.000 |
0.000 |
0.000 |
0.000 |
0.000 |
0.000 |
|
Intercept |
−2.211*** |
−0.754 |
−0.418 |
−3.149*** |
−1.664 |
−5.666*** |
−0.081 |
|
Pseudo-R2 |
0.203 |
0.199 |
0.097 |
0.227 |
0.161 |
0.106 |
0.322 |
|
Keys: Estimates significant at the 10% (*), 5% (**) and 1% (***) thresholds, −1 denotes a lagged variable. Fig. 6 – Econometric models explaining direct selling. Source: French FADN 2006–2014 (continued). |
|||||||
References
Agreste Primeur, 2012, « Un agriculteur sur cinq vend en circuit court », vol. 276.
Ahearn M., Sterns J., 2013, “Direct-to-Consumer Sales of Farm Products: Producers and Supply Chains in the Southeast”, Journal of Agricultural and Applied Economics, vol. 45, p. 497–508.
Aubert M., Enjolras G., 2016, “Do short food supply chains go hand in hand with environment-friendly practices? An analysis of French farms”, International Journal of Agricultural Resources, Governance and Ecology, vol. 12, no 2, p. 189–213.
Aubert M., Perrier-Cornet P., 2012, « La diversification des activités dans les exploitations viticoles françaises ? », Économies et Sociétés, vol. 10-11, p. 1969–1996.
Blanquart C., Gonçalves A., Kebir L., Petit C., Traversac J.-B., Vandenbossche L., 2010, “The Logistic leverages of short food supply chains performance in terms of sustainability”, Paper presented at the 12th WCTR Conference, July 11–15, Lisbon, Portugal.
Capt D., 1994, « Demande de biens différenciés, comportements spatiaux et diversification de l’activité des exploitations agricoles », Doctoral dissertation, University of Dijon.
Capt D. and Schmitt B., 2000, « Économie spatiale et agriculture: les dynamiques spatiales de l’agriculture contemporaine », Revue d’économie régionale et urbaine, vol. 3, p. 385–406.
Carter C.R., Rogers D.S., 2008, “A framework of sustainable supply chain management: moving toward new theory”, International Journal of Physical Distribution & Logistics Management, vol. 38, no 5, p. 360–387
Chiffoleau Y., Gauche A., Ollivier D., 2013, Impacts sociaux des circuits courts alimentaires sur les exploitations agricoles, Centre d’Études et de Ressources sur la Diversification.
Conner D., Colasanti K., Ross R.B. and Smalley S.B., 2010, “Locally Grown Foods and Farmers Markets: Consumer Attitudes and Behaviors”, Sustainability, vol. 2, no 3, p. 742–756.
Detre J.T., Mark B., Mishra A.K., Adhikari A., 2011, “Linkage between Direct Marketing and Farm Income: Double Hurdle Approach”, Agribusiness: an International Journal, vol. 27, no 1, p. 19–23.
DRAAF Limousin, 2012, « Légumes : la vente en circuit court peut encore se développer », Agreste Limousin, vol. 77.
140Enjolras G., Sentis P., 2011, “Crop insurance policies and purchases in France”, Agricultural Economics, vol. 42, no 4, p. 475–486.
Enjolras G., Capitanio F., Aubert M., Adinolfi F., 2014, “Direct payments, crop insurance and the volatility of farm income. Some evidence in France and in Italy”, New Medit, vol. 13, no 1, p. 31–40.
Eurostat, 2015, “Agriculture, forestry and fishery statistics”, 2014 edition. Available at: http://ec.europa.eu/eurostat/web/ess/-/agriculture-forestry-and-fishery-statistics-2014-edition
Feenstra G.W., Lewis C.C., Hinrichs C.C., Gillespie Jr. G.W., Hilchey D., 2003, “Entrepreneurial outcomes and enterprise size in U.S. retail farmers markets”, American Journal of Alternative Agriculture, vol. 18, p. 46–55.
Galli F., Brunori G., 2013, “Short Food Supply Chains as drivers of sustainable development. Evidence Document”, Working paper developed in the framework of the FP7 project Foodlinks (GA No. 265287).
Gilg A.W., Battershill M., 1999, “The role of household factors in direct selling of farm produce in France”, Tijdschrift voor economische en sociale geografie, vol. 90, no 3, p. 312–319.
Goodman D., DuPuis E.M. and Goodman M.K., 2012, “Alternative food networks: knowledge, practice and politics”, Abingdon: Routledge.
Halldorsson A., Kotzab H., Mikkola J.H., Skjøtt-Larsen T., 2007, “Complementary theories to supply chain management”, Supply Chain Management: An International Journal, vol. 12, no 4, p. 284–296.
Ilbery B., Maye D., 2005, “Food supply chains and sustainability: Evidence from specialist food producers in the Scottish/English borders”, Land Use Policy, vol. 22, no 4, p. 331–344.
Jarosz L., 2008, “The city in the country: Growing alternative food networks in Metropolitan areas”, Journal of Rural Studies, vol. 24, no 3, p. 231–244.
Kneafsey M., Venn L., Schmutz U., Balázs B., Trenchard L., Eyden-Wood T., Bos E., Sutton G., Blackett M., 2013, “Short Food Supply Chains and Local Food Systems in the EU. A State of Play of their Socio-Economic Characteristics”, JRC Report 25911.
Lanciano E., Saleilles S., 2010, « Le développement des circuits courts alimentaires : un nouveau souffle entrepreneurial dans l’agriculture ? », Congrès international francophone sur l’entrepreneuriat et la PME, 27 septembre, Bordeaux, France.
Low S.A., Vogel S.J., 2011, “Direct and intermediated marketing of local foods in the United States”, USDA-ERS Economic Research Report.
Martinez S., Hand M., Da Pra M., Pollack S., Ralston K., Smith T., Vogel S., Clark S., Lohr L., Low S., Newman C., 2010, “Local Food Systems: Concepts, Impacts, and Issues”,ERS Report Summary, U.S. Department of Agriculture.
141Penrose E., 1959, The Theory of Growth of the Firm, New York: John Wiley.
Praly C., 2010, « Nouvelles formes de valorisation territoriale en agriculture, le cas de l’arboriculture de la Moyenne Vallée du Rhône », Phd Dissertation, University Lyon 2.
Traversac J., Rousset S., Perrier-Cornet P., 2011, “Farm resources, transaction costs and forward integration in agriculture: Evidence from French wine producers”, Food Policy, vol. 36, p. 839–847.
Verhaegen I., Van Huylenbroeck G., 2001, “Costs and benefits for farmers participating in innovative marketing channels for quality food products”, Journal of Rural Studies, vol. 17, no 4, p. 443–456.
1 Acknowledgments: This article has benefited from the financial support of the French National Research Agency, within the project ANR-11-ALID-0006ILLIAD.
2 Because the FADN database focuses only on farm entities considered as profit centers, we were not able to consider multi-activity in this analysis.