Analysis of logistics practices The contribution of service economics
- Publication type: Journal article
- Journal: European Review of Service Economics and Management Revue européenne d’économie et management des services
2017 – 2, n° 4. varia - Authors: Zeroual (Thomas), Blanquart (Corinne)
- Pages: 49 to 77
- Journal: European Review of Service Economics and Management
Analysis of logistics practices
The contribution of service economics
Thomas Zeroual1
ESCE, CIRCEE
Corinne Blanquart2
IFSTTAR, AME-SPLOTT
Introduction
Traditionally, logistics has been seen as an instrumental activity directly associated with transportation or handling. In that analysis, the sole objective of logistics is to manage the flow of materials, whether simultaneously or as a series (Ellram and Cooper, 1990). This first wave of research, generally looking at logistics within the firm, focused on the objective of cost reduction (Lièvre, 2007). Major logistics concepts such as suppliers and distribution emerged from this research.
The logistics literature then began to take on new dimensions (Harland, 1996; Cristopher, 1998; Maloni and Dewolf, 2006; Savy, 2007). Logistics moved from a closed system of operational activities to a strategic activity that extends beyond the company. The goal was no longer to optimize the pace but rather the coordination3 among activities (Fiore, 1984) and actors (Meunier, Zeroual, 2006). Thus logistics moved 50from managing the flow of materials within the firm to managing this flow among firms (Paché and Spalanzani, 2007). This second wave of logistics research, focused on Toyotism or lean production, highlighted the importance of downstream logistics. Quality became just as important as cost reduction.
The field of Supply Chain Management (SCM) is moving in the somewhat controversial direction of expanding logistics to make the supply chain more cross-functional (Fabbes-Costes, 2007; Spalanzani and Evrard-Samuel, 2007; Livolsi, 2009). SCM emphasizes the management of all logistics processes, from upstream to downstream. In this third wave of research, management tools are developed to evaluate and increase firm performance, which has become the primary objective.
As logistics theory evolves, logistics continues to be seen as a series of processes that are categorized by their function — upstream, production, or downstream. However, there is very little empirical analysis of how logistics practices are established.
The objective of this study is a statistical analysis of company logistics practices and how they relate to each other. We first present our theoretical angle in part 1 and then our methodology in part 2. Finally we show the results of our empirical analysis using the ECHO survey, which traces the movement of almost 17,000 goods from 3,000 French companies.
I. Service economy needs:
Better understanding of logistic diversity
Firms adapt their logistics to their production needs (section 1.1). Specific logistics procedures are chosen depending on the needs and constraints of each business environment (section 1.2).
I.1. Logistics and production type
A firm chooses its logistic strategies based on stakeholder interactions. Logistics should thus find the best intersection of satisfying the company’s partners while working within company constraints. This requires a 51good understanding of how the company works. Beyond ground rules established by stakeholders, a common vision also allows agents to coordinate (Thévenot et al., 2004), although stakeholders may certainly have diverging visions or concepts. Logistic strategies will vary according to production type. There are four production types found in the literature: industrial, flexible, professional, and intangible (see Table 1).
|
Production type |
Logistic strategy |
|
Industrial Standard, generic goods for undifferentiated demand Mass production for economies of scale Specialized production sites (e.g. bulk chemicals) |
Industrial logistics: price is the primary consideration Transportation is contracted out. All modes, including large-scale |
|
Flexible Consumer goods Mass production for differentiated demand (many products within one product line) (e.g. clothing, processed food) |
Complex logistics (need for both speed and EDI); more frequent shipments Primary considerations are reliability (shipping times, damage, service rates) and flexibility (frequent changes in logistic strategy). Road transportation is contracted out. |
|
Professional Small-scale or individual production Made to order, with highly differentiated demand Specialized knowledge (e.g. industrial equipment) |
Basic, small-scale logistics (often dedicated) No contracting out of logistics Transportation provided in-house |
|
Intangible New products, specialized equipment, highly qualified labor (e.g. engineering and IT) |
Logistics contracted out (focus on the trade) |
Tab. 1 – Logistic strategy by production type.
Source: Burmeister, 2000.
Logistic strategy depends on the production type and stakeholder relations. Thus, for the same physical journey, it is possible that the logistic strategy will differ depending on the production type. Three strategies are illustrated in table 2 below: door-to-door shipments, consolidated shipments, and delivery tours. The simplest method is sending a complete shipment from one origin to one destination. The second, consolidated shipments, consists of collecting freight from various 52origins, consolidating it in hubs, and then distributing it to various customers. The third option, the delivery tour, involves delivering to multiple receivers on a delivery route.
|
Industry |
Door-to-door, consolidated, or tour shipment |
||
|
% of number of shipments |
Door-to-door |
Consolidated |
Tour |
|
Metallurgy |
67.96 |
5.37 |
26.66 |
|
Construction materials, glass |
92.80 |
2.03 |
5.18 |
|
Refineries, bulk chemicals |
80.49 |
2.92 |
16.60 |
|
Chemical products |
78.98 |
12.74 |
8.28 |
|
Metalworking |
85.94 |
9.13 |
4.92 |
|
Ind. textiles, tannery |
78.83 |
2.17 |
19.00 |
|
Wood and paper products |
89.93 |
6.13 |
3.93 |
|
Commodity agriculture |
65.57 |
5.99 |
28.44 |
|
Industrial and other goods, salvage |
65.02 |
2.86 |
32.11 |
|
Industrial equipment and machinery |
79.44 |
9.50 |
11.06 |
|
Tools and hardware |
91.40 |
5.23 |
3.37 |
|
Electric or electronic materials |
91.89 |
5.23 |
2.88 |
|
Capital goods |
41.14 |
15.21 |
43.65 |
|
Fresh processed foods |
32.97 |
41.91 |
25.12 |
|
Other processed foods, grain products |
58.09 |
14.99 |
26.92 |
|
Beverages |
38.12 |
10.64 |
51.24 |
|
Fresh foods |
31.63 |
7.56 |
60.81 |
|
Other food products |
16.78 |
5.60 |
77.62 |
|
Clothing and leather goods |
83.62 |
7.56 |
8.82 |
|
Construction materials for transport |
71.38 |
7.19 |
21.43 |
|
Pharmaceuticals |
35.44 |
33.68 |
30.88 |
|
Appliances, hi-fi, electronics |
80.81 |
16.94 |
2.25 |
|
Furniture |
24.07 |
72.77 |
3.15 |
|
Printing and publishing |
74.33 |
16.36 |
9.31 |
|
Jewelry and precious metals |
67.42 |
29.33 |
3.25 |
|
Manufacture of miscellaneous objects |
65.25 |
19.47 |
15.28 |
| 53
Consumer goods, catalog sales |
46.37 |
6.91 |
46.72 |
|
Warehouses |
76.32 |
10.31 |
13.37 |
|
Total (average of all sectors) |
54 |
12 |
34 |
Tab. 2 – Examples of flow strategies.
Source: Blanquart et al., (2010), from the ECHO database.
We see in table 2 that each sector uses the logistic strategies that best meet its needs and constraints. For example, 67.96 % of metallurgy shipments are door-to-door shipments, 5.37 % are consolidated, and 26.66 % are done in delivery tours. There are some similarities between sectors, like, for example, between tools and hardware and electric or electronic materials. On the other hand there are wide variations such as that between construction materials and glass and other food products.
I.2. Diversified practices for each business environment
Firms choose particular service providers to respond to stakeholder needs. Logistic practices can be seen as full-fledged services. According to Gadrey (1991), a service activity is an operation that brings about a change in material C that consumer B owns or uses, created by supplier A at B’s behest and often in cooperation with B; this change does not create a new good that can circulate independently of C. This definition is often referred to as the “service triangle”.
There are several fundamental characteristics of a service. First, it cannot be stored (Stanback, 1979). Second, services are intangible, although they are used in the material world. Finally, the process that creates service products involves an interaction between supplier and user (Fuchs, 1968; Djellal and Gallouj, 2006). This final point is key because it indicates a potential multiplicity of services based on the potential supply, the demands of the user, and the compromises each side is willing to make.
This multiplicity of services can be classified into four different types (Gadrey, 1991):
–Materials processing (M), which consists of manipulating tangible items through transportation, alteration, maintenance, and repair;
54–Information processing (I), which consists of manipulating codified information: producing, interpreting, and diffusing it. These services are generally information processing and coding operations, carried out using information technology for internal and external use with the aim of managing work speed, quality, and efficiency. The primary tools used include databases and quality control tools;
–Relational service (R), in which the client is the main subject and face-to-face contact is key;
–Competency-based services, in which skills are used directly or through technology (C).
These types of services can be seen in Table 3.
|
Primary function Examples of logistics practices |
M Materials processing |
I Information processing |
R Relational service |
C Competency-based service |
|
Physical transport |
X |
|||
|
Consolidation/deconsolidation |
X |
|||
|
Container loading |
X |
|||
|
Storage |
X |
|||
|
Product finalization |
X |
|||
|
Inventory management |
X |
|||
|
Quality control |
X |
|||
|
Shipment tracking software |
X |
|||
|
Electronic proof of delivery |
X |
|||
|
Complete tracking of trip |
X |
|||
|
Number of transportation providers |
X |
|||
|
Type of contracts |
X |
|||
|
Number of logistics suppliers |
X |
|||
|
Unskilled labor |
X |
|||
|
Semiskilled labor |
X |
|||
|
Skilled labor |
X |
|||
| 55
Highly skilled labor |
X |
|||
|
Supply chain management |
X |
|||
|
Creation of distribution networks |
X |
|||
|
Supply chain planning |
X |
|||
|
… |
Tab. 3 – Logistics practices by type of service.
The logistics practices implemented by firms can thus be categorized as type M, I, R, or C. This has theoretical interest because it highlights the service nature of these practices, which standard analyses (upstream, production, downstream) tend to ignore. This organization by type of service can become an evaluative tool to understand why firms choose certain logistics practices, as we will see in parts 2 and 3.
I. Methodology:
Analyzing ECHO data
The ECHO survey created by INRETS (National Institute of Research on Transportation and Transportation Security) provides extensive information on decisions made by French firms. In section 2.1 we describe the scope of this survey. In section 2.2, we present the variables we used to analyze the logistics practices used in France. Finally, our statistical methods are explained in 2.3 and then applied in part 3.
II.1. The ECHO database
We use the ECHO database to track complete transportation chains from various French firms. The ECHO4 survey (or Loaders and Operators Survey) provides representative information on all aspects of transport and logistics for merchandise in France. It is the second survey of this 56magnitude carried out by INRETS5. The national survey covers about 10,000 shipments from 3,000 firms and tracks 17,000 complete journeys. We hope to gain from it a detailed understanding of all the procedures carried out as an object moves from one end of the chain to the other, from the loader through all the intermediaries, transportation providers, and logisticians, to the end user. The survey should also provide insight about production systems.
There are two major databases6 we use from this survey: one for firms and the other for shipments. The firm database includes the firm characteristics, the production conditions (product variety, production for warehousing or on demand, etc.), choice of transport, and business partners. The shipment database recreates the physical chain the merchandise follows: information about the recipient, the physical characteristics of the shipment (weight, volume, and packaging) and types of transport (what mode is used and why, whether transportation is contracted out, and whether the company owns its vehicles). We will analyse these two different tables (“firms” and “shipments”) from the ECHO survey to analyze logistics and transportation strategy.
II.2. Variables
The variables and their categories can be seen in Table 4 below, that include type of service, practices mentioned in the ECHO database, categories (yes or no) and average use in percentage.
|
Type of service |
Practices mentioned in the ECHO database |
Categories |
Average use in % |
|
M Materials processing |
Change of mode of transport Change of vehicle Consolidation/deconsolidation Storage Product finalization, packaging, labeling |
Yes: M1A / No: M0A Yes: M1B / No: M0B Yes: M1C / No: M0C Yes: M1D / No: M0D Yes: M1E / No: M0E |
3,25/96,74i 33,25/66,74 30,95/69,04 5,88/94,11 12,15/87,84 |
| 57
I Information processing |
Use of software tools Vehicle tracking system Shipment tracking software Electronic proof of delivery Inventory or order management |
Yes: I1A / No: I0A Yes: I1B / No: I0B Yes: I1C / No: I0C Yes: I1D / No: I0D Yes: I1E / No: I0E |
4,59/95,40 2,55/97,45 32,69/67,31 22,32/77,17 5,5/94,4 |
|
R Relational service |
Types of contracts Number of transportation providers Number of logistics practices |
Long-term contract: R1B / Temporary contract: R0B Both: R2B 1: R1A <1: R2A 1: R1C / <1: R2C |
19,31 33,90 9,48 6,91/84,18 11,15/21,30 |
|
C Competency-based serviceii |
Unskilled labor Semi-skilled labor Skilled labor Highly skilled labor |
Yes: C0A / No: C1A Yes: C0B / No: C1B Yes: C1C / No: C0C Yes: C1D / No: C0D |
9,93/90,06 47,90/52,09 29,08/70,91 13,07/90,92 |
i.For average use, the percentages do not always add up to 100 % because of missing responses.
ii.The row “competency-based service” needs to be read carefully. The question was “Does the job not require skilled labor? If respondents answered “yes,” it was counted as unskilled labor; if not, as skilled labor. The same method was true for the category “uncertified expertise”. We followed the question headings in the ECHO database.
Tab. 4 – Service types, practices,
and categories from the ECHO survey.
II.3. Statistical analysis
II.3.1. Using PCA to understand
correlations for each logistics practice
Using the descriptive table above, we can look for correlations in the categories of the logistics practices for each service type. Several combinations are possible. The value of V can vary from -1 to 1. A positive or negative value corresponds to a positive or negative correlation, respectively. The goal is to determine the closeness of proximity for each logistic practice in each service type. For example, in materials processing, it is possible to learn whether a change in mode of transport would be more likely to co-occur with a change in vehicle or some 58other logistics practice. We illustrate these potential correlations in Table 5 below.
|
Service type |
Categories |
Transformation |
|
M Materials processing |
Yes: M1A / No: M0A Yes: M1B / No: M0B Yes: M1C / No: M0C Yes: M1D / No: M0D Yes: M1E / No: M0E |
-1 < V < 1? |
|
I Information processing |
Yes: I1A / No: I0A Yes: I1B / No: I0B Yes: I1C / No: I0C Yes: I1D / No: I0D Yes: I1E / No: I0E |
-1 < V < 1? |
|
R Relational service |
Long-term contract: R1B / Temporary contract: R0B Both: R2B 1: R1A <1: R2A 1: R1C / <1: R2C |
-1 < V < 1? |
|
C Competency-based service |
Yes: C0A / No: C1A Yes: C0B / No: C1B Yes: C1C / No: C0C Yes: C1D / No: C0D |
-1 < V < 1? |
Tab. 5 – Transformation in each service type.
We used the indicators in Table 5 to analyze the data. The first step was to carry out a Principal Component Analysis (PCA), which provides a visual overview of whether the practices are positively or negatively correlated. The graphs have two axes: the horizontal F1 axis and the vertical F2 axis.
To analyze a PCA graph, it is important to determine the direction of the vectors: the line between the center of the axes and the endpoint of the vector. When the directions of the vectors have similar values or form an angle close to 0o, the variables are dependent or positively correlated. When the vector directions are orthogonal, the variables are independent. Finally, if the vector directions form a 180o angle or an angle that is symmetric to the center of the axes, the variables are negatively correlated. It should be noted that the points closest to the center of the axes are the most difficult to interpret. In this study, however, most of the points are around the diameter of the axes and are 59thus easy to interpret. Finally, in the best-case scenario, the two axes F1 and F2 should add up to 100 %: a higher percentage of variability indicates a more reliable analysis. In our study, this percentage ranged from 65-95 %.
II.3.2. Using MFA to understand correlations between service types
After this first analysis, it is now possible to look for correlations among service types. We use multiple factor analysis (MFA), which can be interpreted in a similar manner to PCA. We illustrate these potential correlations in Table 6 below.
|
Service types |
M |
I |
R |
C |
|
M |
- |
-1 < V < 1 |
-1 < V < 1 |
-1 < V < 1 |
|
I |
- |
-1 < V < 1 |
-1 < V < 1 |
|
|
R |
-1 < V < 1 |
-1 < V < 1 |
- |
-1 < V < 1 |
|
C |
-1 < V < 1 |
-1 < V < 1 |
-1 < V < 1 |
- |
Tab. 6 – Potential correlations among service types.
II.3.3. Using CCA to understand correlations
between logistics services and service types
At this stage we analyze the service types that have been found to be closest to one another. In this second analysis, we can see which practices are positively or negatively correlated to each other within the most closely related service types. We use canonical correlation analysis (CCA) to understand the totality of the correlations. Columns 3, 4, and 5 of Table 7 show the combinations of logistics practices for materials processing.
|
Service types |
M |
I |
R |
C |
|||||||||
|
Category |
M1 |
M2 |
… |
I1 |
I2 |
… |
R1 |
R2 |
… |
C1 |
C2 |
… |
|
|
M |
M1 |
- |
-1 < V < 1 |
-1 < V < 1 |
|||||||||
|
M2 |
-1 < V < 1 |
- |
-1 < V < 1 |
||||||||||
|
… |
-1 < V < 1 |
-1 < V < 1 |
- |
||||||||||
| 60
I |
I1 |
-1 < V < 1 |
-1 < V < 1 |
-1 < V < 1 |
- |
||||||||
|
I2 |
-1 < V < 1 |
-1 < V < 1 |
-1 < V < 1 |
- |
|||||||||
|
… |
-1 < V < 1 |
-1 < V < 1 |
-1 < V < 1 |
- |
|||||||||
|
R |
R1 |
-1 < V < 1 |
-1 < V < 1 |
-1 < V < 1 |
- |
||||||||
|
R2 |
-1 < V < 1 |
-1 < V < 1 |
-1 < V < 1 |
- |
|||||||||
|
… |
-1 < V < 1 |
-1 < V < 1 |
-1 < V < 1 |
- |
|||||||||
|
C |
C1 |
-1 < V < 1 |
-1 < V < 1 |
-1 < V < 1 |
- |
||||||||
|
C2 |
-1 < V < 1 |
-1 < V < 1 |
-1 < V < 1 |
- |
|||||||||
|
… |
-1 < V < 1 |
-1 < V < 1 |
-1 < V < 1 |
- |
|||||||||
Tab. 7 – Potential correlations among logistics practices.
Figure 1 summarizes the steps of our methodology. A horizontal, vertical, then diagonal reading ensures a complete analysis of logistics practices. The order of each step is also important: Step 3 would be difficult to interpret without having looked at the first two steps. Eliminating the first two steps would also involve overlooking a great deal of information, as will be discussed in part 3.
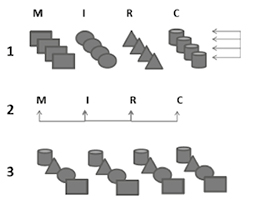
Fig. 1 – The steps of our methodology.
61I. Empirical tests
We have three aims for this last section: First we will look at the relationships between logistics practices within each service type. Then we will look at the relationships between service types. Finally we will analyze the relationships of the practices and the most representative service types.
III.1. Identifying the correlations for each logistics practice
In figure 2, the horizontal F1 axis distinguishes the firms that use materials processing practices. The F2 axis distinguishes the firms that change vehicles during the transportation of merchandise. Therefore there is a substantial difference between users and non-users of materials processing services.
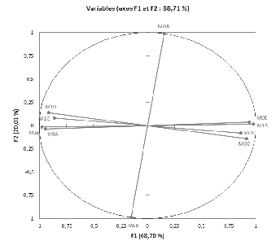
Fig. 2 – Correlations of variables in materials processing.
Source: ECHO; own calculations.
62A Pearson coefficient analysis is useful for refining the links between practices (see Table 8 for Materials Processing and Appendix 1 for the other types). We focus on variables used by firms: a variable with the number 1. Thus, change in the mode of transport (variable M1A) has a strong correlation with storage (variable M1D) and product finalization, packaging, and labeling (variable M1E). Changing vehicles during transport (variable M1B) is weakly correlated with all the other variables. Here we encounter the distinction between the F1 and F2 axes. Consolidation/deconsolidation (variable M1C) is strongly correlated with storage (variable M1D) and product finalization, packaging, and labeling (variable M1E). Consolidation/deconsolidation requires careful organization for receiving and resending freight, so it is not surprising that this variable is positively correlated with these other two variables.
|
M1A |
M0A |
MOB |
M1B |
MOC |
M1C |
MOD |
M1D |
M0E |
M1E |
|
|
M1A |
1 |
-1,000 |
-0,161 |
0,161 |
-0,687 |
0,687 |
-0,838 |
0,838 |
-0,933 |
0,933 |
|
M0A |
-1,000 |
1 |
0,161 |
-0,161 |
0,687 |
-0,687 |
0,838 |
-0,838 |
0,933 |
-0,933 |
|
MOB |
-0,161 |
0,161 |
1 |
-1,000 |
0,063 |
-0,063 |
0,017 |
-0,017 |
0,154 |
-0,154 |
|
M1B |
0,161 |
-0,161 |
-1,000 |
1 |
-0,063 |
0,063 |
-0,017 |
0,017 |
-0,154 |
0,154 |
|
MOC |
-0,687 |
0,687 |
0,063 |
-0,063 |
1 |
-1,000 |
0,709 |
-0,709 |
0,813 |
-0,813 |
|
M1C |
0,687 |
-0,687 |
-0,063 |
0,063 |
-1,000 |
1 |
-0,709 |
0,709 |
-0,813 |
0,813 |
|
MOD |
-0,838 |
0,838 |
0,017 |
-0,017 |
0,709 |
-0,709 |
1 |
-1,000 |
0,845 |
-0,845 |
|
M1D |
0,838 |
-0,838 |
-0,017 |
0,017 |
-0,709 |
0,709 |
-1,000 |
1 |
-0,845 |
0,845 |
|
M0E |
-0,933 |
0,933 |
0,154 |
-0,154 |
0,813 |
-0,813 |
0,845 |
-0,845 |
1 |
-1,000 |
|
M1E |
0,933 |
-0,933 |
-0,154 |
0,154 |
-0,813 |
0,813 |
-0,845 |
0,845 |
-1,000 |
1 |
Tab. 8 – Pearson matrix.
In Figure 3, to the right of the F1 axis are firms that do not use electronic tools en route. Only I1B, vehicle tracking system, is correlated with no shipment tracking software and no electronic proof of delivery. One possible interpretation for this finding is that firms that have this type of vehicle do not need additional technology to inform stakeholders about the movement of the merchandise.
The F2 axis is less representative; however, four distinct quadrants can be seen. Group I0A – I0E, in the upper right, and its counterpart 63I1E – I1E, in the lower left, indicate a strong correlation between supplier interface and inventory and order management. This would imply a desire to avoid shortages: firms that are informed about their suppliers’ inventory still need to manage their own inventory and orders. Group I0C – I0D, in the lower right, and its counterpart I1C – I1D, in the upper left, show a strong correlation between shipment tracking software and electronic proof of delivery. Knowing where a product is located goes with knowing that it has been delivered.
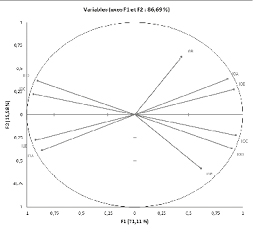
Fig. 3 – Correlation of information processing variables.
Source: ECHO; own calculations.
In Figure 4, axes F1 and F2 have a similar effect on correlations: 36 % and 32 %, respectively. To the right of the F1 axis are the firms with more than one transportation provider and more than one service provider with temporary contracts. Below the F2 axis are firms that use more than one transportation provider with a long-term contract. The F1 axis is easy to interpret due to a reliable variable based on the number of service providers, but the F2 axis is difficult to read. We therefore 64carry out a further analysis by quadrant. Moving clockwise, we begin with R2C – R0B, which shows a correlation between a large number of service providers and the widespread use of temporary contracts. We have the R2A and then the R1B axes countering this first group and the last one, R1A – R2B – R1C, connecting the variables of a single transportation provider, a mix of long-term and temporary contracts, and a single logistics service provider.
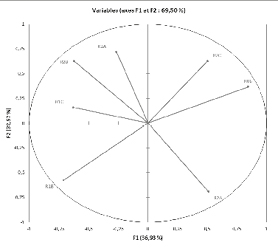
Fig. 4 – Correlation of relational service variables.
Source: ECHO; own calculations.
To see if the two contract types correlate more with a single transportation provider or a single logistics service provider, we carried out a correlation test, the results of which can be seen in Table 9. Variable R2B, both contract types, seems to be somewhat more strongly correlated with variable R1A, a single transportation provider, than with variable R1C, a single logistics service provider, with Pearson coefficients of 0.510 and 0.444, respectively. The difference is quite minor.
65|
Correlation matrix (Pearson (n)): |
|||
|
Variables |
R1A |
R2B |
R1C |
|
R1A |
1 |
0,510 |
0,067 |
|
R2B |
0,510 |
1 |
0,444 |
|
R1C |
0,067 |
0,444 |
1 |
Tab. 9 – Correlations between transportation provider,
logistics service provider, and contract types.
In Figure 5, the F1 axis distinguishes the firms that require skilled labor from those that require less skilled labor. A wide variety of skills seems to be important along this axis. The F2 axis distinguishes the companies that require more basic skills and qualifications. The firms seem to be differentiated by average required skill level.
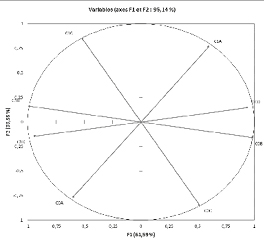
Fig. 5 – Correlation of competency-based service variables.
Source: ECHO; own calculations.
66III.2. Identifying correlations
among the different service types
We used MFA to see the connections between different service types. The MFA graphs can be read in the same way a PCA graph is (see Figure 6).
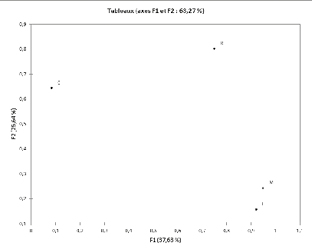
Fig. 6 – Service types.
Source: ECHO; own calculations.
Materials and information processing are closely connected along the F1 axis. Competency-based services are closely connected to the F2 axis, while relational services are related to both axes. This demonstrates the importance of relationships in the service industry (Gadrey, 2003).
We can now calculate the degree of congruence among M, I, R, and C using RV coefficients as seen in Table 10 below. The RV coefficient is a generalization of the Pearson coefficient and is easy to interpret because it takes values between 0 and 1. The closer the coefficient is to 1, the 67more similar the matrices are. In our case, the closer the coefficients are to 1, the more closely the service types are related.
|
RV coefficients: |
|||||
|
C |
R |
I |
M |
AFM |
|
|
C |
1,000 |
0,255 |
0,068 |
0,190 |
0,506 |
|
R |
0,255 |
1,000 |
0,575 |
0,589 |
0,833 |
|
I |
0,068 |
0,575 |
1,000 |
0,892 |
0,816 |
|
M |
0,190 |
0,589 |
0,892 |
1,000 |
0,862 |
|
AFM |
0,506 |
0,833 |
0,816 |
0,862 |
1,000 |
Tab. 10 – Contribution of each service type
and correlations among service types.
It is apparent that materials processing has the most weight in this analysis, at 0.862, followed by relational services with 0.833 and information processing at 0.816. Table 10 also shows how the service types are correlated with each other; some are more strongly correlated than others, as seen in Table 11.
|
Service type |
Strong correlation |
Moderate correlation |
Weak correlation |
|
M |
M + I: 0,892 |
M + R: 0, 589 |
M + C: 0,190 |
|
I |
I + M: 0,892 |
I + R: 0,575 |
I + C: 0,0068 |
|
R |
R + M: 0,589 et R +I: 0,575 |
R + C: 0,255 |
|
|
C |
C + R: 0,255 |
Tab. 11 – Summary of correlations between service types.
Materials and information processing are the most closely related service types, followed by materials processing and relational services and then information processing and relational services. In section 3.3 we will further analyze the relationships among the practices in each service type.
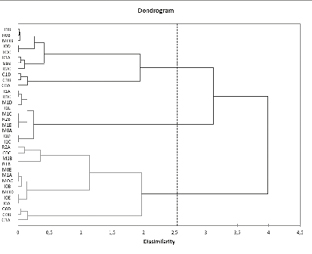
68III.3. Correlations among logistics practices
Hierarchical clustering analysis (HCA) is the tool that would seem the most effective in finding the relationships between all the logistics practices. This technique allows us to visualize all the relationships in one diagram (a dendogram. See Appendix 2). We present the results of our statistical analysis in Appendix 1, but this statistical technique did not turn out to be useful. In our case, the interest lies in targeting the strong and moderate correlations: M+I, M+R, and I+R. There is little point in testing correlations that have already been found to be weak. We therefore chose to use CCA, which turned out to be the most appropriate tool for analyzing these two groups of variables. The CCA analysis can be interpreted in the same way as an MFA analysis.
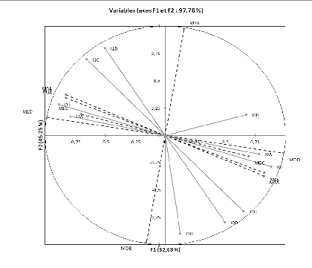
Fig. 7 – Relationships between materials and information processing.
Source: ECHO; own calculations.
69In Figure 7, to the left of the F1 axis are the firms that use materials and information processing practices. Variable M0A, no change in mode of transportation, is the only exception. It is interesting to note the close proximity of the practices used; for example, the material practices consolidation/deconsolidation, product finalization, packaging, and labeling are closely related to the information practices of inventory management, electronic proof of delivery, and shipment tracking software. These close relationships make sense, since the information practices facilitate the material practices.
The F2 axis divides firms that change vehicles en route and those that do not. Here it is interesting to note the close proximity of variable M0B, no vehicle change, and variable I1B, vehicle tracking system. Firms that make the substantial investment in vehicle tracking systems are unlikely to switch vehicles en route.
We also see at the lower end of the F2 axis that variable I0D, no electronic proof of delivery, variable I0C, no shipment tracking software, and variable I1B, vehicle tracking system, are in close proximity to each other.
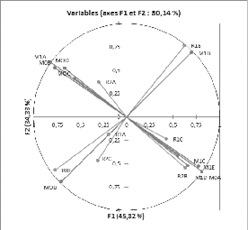
Fig. 8 – Relationships between material and relational practices.
Source: ECHO; own calculations.
70In Figure 8, we need to ignore variables R1A, R2C, and R2A because they are too close to the center of the circle. We can see four quadrants in this graph; moving clockwise, the first group is R1B and M1B. Firms have stable relationships and long-term contracts with their service providers when a change of vehicle en route is required. This relatively atypical transportation chain requires a relationship of trust. The next quadrant combines a mix of temporary and long-term contracts with several material practices of varying complexity implemented by different service providers, which could explain the mix of contract types. The third and fourth quadrants are basically the mirror images of the first and second.
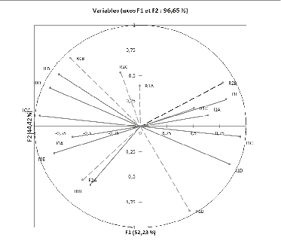
Fig. 9 – Relationships between information and relational practices.
Source: ECHO; own calculations.
In Figure 9, the F1 axis separates out the firms that use information practices and a mix of contracts. Specifically, inventory management, I1E; electronic proof of delivery, I1C; and shipment tracking software, 71I1D, are all related to a mix of contract types. As with material practices, the variance in types of services provided could explain the different contract types.
It is more difficult to interpret the F2 axis. It would seem to divide firms by the number of transportation providers and logistics service providers, but this interpretation is difficult to confirm because variables R1A and R2C are too close to the center of the circle to be considered.
Conclusion
The literature points to a growing diversity of logistics practices in response to increasingly complex challenges. Still, there is little research on which practices firms most frequently used. This study, however, has been a source of important lessons:
–There is a wide variety of practices associated with each service type. Studying each service type in fact highlights its role in the organization. In terms of materials processing, changing the mode of transportation and consolidation/deconsolidation correspond with storage, product finalization, and packaging. For information processing, firms that have a vehicle tracking system do not need other technological systems to keep stakeholders informed of the progress of the merchandise. Our study of relational services shows that loyalty, expressed in long-term contracts, varies depending on the number of service providers. Finally, we were able to distinguish between firms that used more or less high-skilled labor.
–Each service type functions independently; there are not strong connections among all service types. There are, however, services that work in tandem: material and information processing, information and relational services, and material and relational services (see Table 12).
72|
Service types |
Practice types |
|
M + I |
Consolidation/deconsolidation, product finalization, packaging, and labeling with Inventory management Electronic proof of delivery Shipment tracking software |
|
R + M |
Long-term contracts with Change of vehicle Mixed contract types with Consolidation/deconsolidation Storage Product finalization, packaging, and labeling |
|
I + R |
Mixed contract types with Inventory management Electronic proof of delivery Shipment tracking software |
Tab. 12 – Summary of main correlations among logistics practices.
–There is a certain congruity of practices and service types: the relationships among practices within different service types make sense. For example, the material practices consolidation/deconsolidation, product finalization, packaging, and labeling are closely related to the information practices of inventory management, electronic proof of delivery, and shipment tracking software. It would be difficult to carry out those material processes without the information practices. Moreover, firms have more stable, long-term relationships with their transportation providers when their transportation chain requires changing vehicles en route. Finally, we identified a group of firms that engage information services using mixed contract types. As with material services, the variety of these services and the range of their technical complexity could explain the range of contract types.
73References
Bernadet M. (2008), « Introduction: Transport et logistique durables. Vers la nécessaire pris une compte de leur interdépendance », Notes de synthèses du SESP, January, February.
Blanquart C., Carbone V., Zeroual T. (2010), « Définition et évaluation de la durabilité du transport de marchandises: l’apport de l’économie des services », Économies et sociétés, 44 (2), p. 287-310.
Burmeister A. (2000), Familles logistiques: propositions pour une typologie des produits transportés pour analyser les évolutions en matière d’organisation des transports et de la logistique, INRETS.
Christopher M. (1998), “Logistics and supply chain management: strategies for reducing cost and improving service” London, Financial times.
Djellal F., Gallouj F. (2006), « La relation innovation-emploi dans les services: un bilan et un agenda de recherche », Travail et Emploi, no 108, October-December, p. 45-56
Drapier L., (2004), Stratégies logistiques, Paris, Économica.
Ellram L. M., & Cooper M. C. (1990), “Supply chain management, partnership, and the shipper-third party relationship”, The International Journal of Logistics Management, 1 (2), p. 1-10.
Fabbe-Costes N., & Jahre M. (2007), “Supply chain integration improves performance: the Emperor’s new suit?”, International Journal of Physical Distribution & Logistics Management, 37 (10), p. 835-855.
Fiore C. (1984), « L’impact de la logistique sur l’industrie: la production flexible », Revue d’économie industrielle, 29 (1), p. 18-25.
Fuchs V. R. (1968), The service economy, New York, NBER-Columbia University Press.
Gadrey J. (1991), « Le service n’est pas un produit: quelques implications pour l’analyse économique et pour la gestion », Politiques et Management Public, 9 (1) p. 1-24.
Gadrey J. (2003), Socio-économie des services, Paris, La Découverte.
Gallouj F., Savona M. (2009), “Innovation in services: a review of the debate and a research agenda”, Journal of evolutionary economics, 19 (2), 149-172.
Guilbault M. (1994), « Quels besoins pour les chargeurs? Variété de la demande et choix de transport », INRETS report, no 178.
Harland C. M. (1996), Supply chain management: relationships, chains and networks, British Journal of management, 7 (1), p. 63-80.
Lièvre P. (2007), La logistique, coll. Repères, Paris, La Découverte.
74Livolsi L., (2009), Le Supply Chain Management: synthèses et propositions, XVIIIème conférence de l’AIMS, Grenoble, 2-5 juin.
Maloni M., & DeWolf F. (2006), Understanding radio frequency identification (RFID) and its impact on the supply chain. Penn State Behrend–RFID Center of Excellence, available at: www.ebizitpa.org/Education/Operations/RFID/RFIDresearchPSU.pdf (accessed April 2, 2007).
Meunier C., & Zéroual T. (2006), « Transport durable et développement économique », Développement durable et territoires, Dossier 8.
Mathé H., Tixier D. (1987), La logistique, Paris, collection Que-sais-je?, PUF.
Paché G., & Spalanzani A. (2007), « La gestion des chaines logistiques multi-acteurs: perspectives stratégiques » (p. 255). PUG.
Savy M., (2007), Le transport de marchandises, Paris, Eyrolles, Editions d’Organisation.
Spalanzani A., & Samuel K. E. (2007), “Absorbing uncertainty within supply chains”, International Journal of Productivity and Quality Management, 2 (4), p. 441-458.
Stanback T. M. (1979), Understanding the service economy: Employment, productivity, location, Baltimore, Johns Hopkins University Press.
Thévenot L., Eymard-Duvernay F., Favereau O., Orléan A., & Salais R. (2004), « Valeurs, coordination et rationalité. L’économie des conventions ou le temps de la réunification dans les sciences sociales », Problèmes économiques, 2838, p. 1-8.
75Appendix 1
Pearson Matrix for Information Processing,
Relational service and Competency-based Service
|
I1A |
I0A |
I1B |
I0B |
IOC |
I1C |
I0D |
I1D |
I0E |
I1E |
|
|
I1A |
1 |
-1,000 |
-0,239 |
-0,494 |
-0,655 |
0,655 |
-0,694 |
0,694 |
-0,839 |
0,839 |
|
I0A |
-1,000 |
1 |
0,239 |
0,494 |
0,655 |
-0,655 |
0,694 |
-0,694 |
0,839 |
-0,839 |
|
I1B |
-0,239 |
0,239 |
1 |
0,211 |
0,733 |
-0,733 |
0,691 |
-0,691 |
0,348 |
-0,348 |
|
I0B |
-0,494 |
0,494 |
0,211 |
1 |
0,353 |
-0,353 |
0,043 |
-0,043 |
0,516 |
-0,516 |
|
IOC |
-0,655 |
0,655 |
0,733 |
0,353 |
1 |
-1,000 |
0,879 |
-0,879 |
0,807 |
-0,807 |
|
I1C |
0,655 |
-0,655 |
-0,733 |
-0,353 |
-1,000 |
1 |
-0,879 |
0,879 |
-0,807 |
0,807 |
|
I0D |
-0,694 |
0,694 |
0,691 |
0,043 |
0,879 |
-0,879 |
1 |
-1,000 |
0,721 |
-0,721 |
|
I1D |
0,694 |
-0,694 |
-0,691 |
-0,043 |
-0,879 |
0,879 |
-1,000 |
1 |
-0,721 |
0,721 |
|
I0E |
-0,839 |
0,839 |
0,348 |
0,516 |
0,807 |
-0,807 |
0,721 |
-0,721 |
1 |
-1,000 |
|
I1E |
0,839 |
-0,839 |
-0,348 |
-0,516 |
-0,807 |
0,807 |
-0,721 |
0,721 |
-1,000 |
1 |
|
R1A |
R2A |
R1B |
R0B |
R2B |
R1C |
R2C |
|
|
R1A |
1 |
-0,511 |
-0,115 |
-0,034 |
0,510 |
0,067 |
0,293 |
|
R2A |
-0,511 |
1 |
0,037 |
0,141 |
-0,625 |
-0,425 |
-0,144 |
|
R1B |
-0,115 |
0,037 |
1 |
-0,960 |
0,061 |
0,100 |
-0,526 |
|
R0B |
-0,034 |
0,141 |
-0,960 |
1 |
-0,337 |
-0,218 |
0,455 |
|
R2B |
0,510 |
-0,625 |
0,061 |
-0,337 |
1 |
0,444 |
0,147 |
|
R1C |
0,067 |
-0,425 |
0,100 |
-0,218 |
0,444 |
1 |
-0,450 |
|
R2C |
0,293 |
-0,144 |
-0,526 |
0,455 |
0,147 |
-0,450 |
1 |
|
C0A |
C1A |
C0B |
C1B |
C1C |
C0C |
C1D |
C0D |
|
|
C0A |
1 |
-1,000 |
-0,484 |
0,484 |
-0,300 |
0,300 |
0,589 |
-0,589 |
|
C1A |
-1,000 |
1 |
0,484 |
-0,484 |
0,300 |
-0,300 |
-0,589 |
0,589 |
|
C0B |
-0,484 |
0,484 |
1 |
-1,000 |
-0,652 |
0,652 |
-0,873 |
0,873 |
|
C1B |
0,484 |
-0,484 |
-1,000 |
1 |
0,652 |
-0,652 |
0,873 |
-0,873 |
|
C1C |
-0,300 |
0,300 |
-0,652 |
0,652 |
1 |
-1,000 |
0,309 |
-0,309 |
| 76
C0C |
0,300 |
-0,300 |
0,652 |
-0,652 |
-1,000 |
1 |
-0,309 |
0,309 |
|
C1D |
0,589 |
-0,589 |
-0,873 |
0,873 |
0,309 |
-0,309 |
1 |
-1,000 |
|
C0D |
-0,589 |
0,589 |
0,873 |
-0,873 |
-0,309 |
0,309 |
-1,000 |
1 |
Appendix 2
Dendogram
1 Associate Professor, ESCE, CIRCEE. Email: thomas.zeroual@esce.fr
2 Corinne Blanquart, Research Director, IFSTTAR, AME-SPLOTT. Email: corinne.blanquart@ifsttar.fr
3 In this article, coordination is defined as making firms’ individual economic decisions compatible with each other through a series of mechanisms.
4 For more information: http://www.inrets.fr/ur/splott/ECHO/
5 The first survey was conducted in 1988 and was called “Loader Survey”. See, for example: Guilbault (1994).
6 There are three more databases or questionnaires in the ECHO database: the “pre-interview” questionnaire, the “participant” questionnaire, and the “route” questionnaire. However, we used primarily the “shipments” and “firms” databases in our study. It should be noted that the data we use comes from face-to-face interviews.
- CLIL theme: 3306 -- SCIENCES ÉCONOMIQUES -- Économie de la mondialisation et du développement
- ISBN: 978-2-406-07406-9
- EAN: 9782406074069
- ISSN: 2555-0284
- DOI: 10.15122/isbn.978-2-406-07406-9.p.0049
- Publisher: Classiques Garnier
- Online publication: 11-13-2017
- Periodicity: Biannual
- Language: English
- Keyword: Logistics, service economics, strategy, evaluation, ECHO survey