Intensifications agricoles et politiques pour éradiquer la faim et stabiliser le climat
- Type de publication : Article de revue
- Revue : Systèmes alimentaires / Food Systems
2021, n° 6. varia - Auteur : Riedacker (Arthur)
- Résumé : Généraliser les grandes cultures à bas niveaux d'intrants ou bio augmenterait significativement émissions de GES et malnutritions. Optimiser partout les productions de biomasses par hectare devrait être prioritaire, y compris dans les négociations internationales. Les pays riches devraient co-subventionner les intrants agricoles en Afrique et consommer moins de protéines animales. Les régimes moins carnés de l'agriculture raisonnée devraient être rendus aussi sains que ceux « plutôt bio ».
- Pages : 281 à 304
- Revue : Systèmes alimentaires
- Thème CLIL : 3306 -- SCIENCES ÉCONOMIQUES -- Économie de la mondialisation et du développement
- EAN : 9782406127055
- ISBN : 978-2-406-12705-5
- ISSN : 2555-0411
- DOI : 10.48611/isbn.978-2-406-12705-5.p.0281
- Éditeur : Classiques Garnier
- Mise en ligne : 05/01/2022
- Périodicité : Annuelle
- Langue : Anglais
- Mots-clés : objectif de développement durable des Nations-Unies, agriculture bio, agriculture à bas niveaux d’intrants, cofinancement Nord-Sud des intrants agricoles en Afrique, régime alimentaire sain.
Agricultural intensification
and policies for hunger eradication
and climate stabilization
Arthur Riedacker
Oikos Institute and IFSDAA
Introduction
“Sustainable diets are diets with low environmental impacts which contribute to food and nutrition security and to healthy life for present and future generations”. [They] “are protective and respectful of biodiversity and ecosystems, culturally acceptable, accessible, economically fair and affordable, nutritionally adequate, safe and healthy, while optimizing Natural and Human Resources” (FAO, 2011). But is it possible to produce enough healthy food in each sub-region of the world to meet the double challenge of eradicating hunger by 2030, and carbon neutrality to stabilize the climate by 2050, as decided in 2015 by the U.N. SDGs (sustainable development goals) and the Paris Agreement on Climate? According to the World Food Program more than 800 million people, out of 8.5 billion are likely to still be hungry by 2030. Whereas the world population is still to increase up to about 9.5 billion in 2050. In addition, according to UNEP (2019) the “emission gap is large. In 2030, annual emissions need to be 15 GtCO2e lower than current unconditional NDCs (National Determined Contributions) of Countries imply for the 2oC goal, and 32 GtCO2e lower for the 1.5 oC”. That means that emissions from food production, today about 30% of global GHG emissions (IPCC, 2019), are also to be reduced; by “enhanced agricultural management as well as by demand-side measures such as dietary shifts 282towards more sustainable plant-based diets and measures to reduce food waste; by “zero net deforestation and the adoption of policies to restore land carbon stocks and protect natural ecosystems, aiming for significant net CO2 uptake in this sector” (UNEP, 2019). Due to climate change food production will also be threatened in many regions.
This request trying to increase land-use efficiency (e.g., total annual food and non-food biomass production per hectare), and also to consider health issues. Healthy diets should not only provide enough calories and proteins per capita, be equilibrated and contain adequate quantities of vitamins, minerals (iron, copper iodine, zinc, magnesium, selenium, etc.), fibers et other micronutrients such as omega 3 and 6. They should also not contain unsafe levels of mycotoxins, hormones, phytopharmaceutical residues, heavy metals, or possibly carcinogenic substances.
Up to now the feasibility of meeting the triple challenge of “hunger eradication-carbon neutrality-healthy food production” has hardly been considered. Territorial and carbon constraints have largely been ignored by scientists involved in organic farming and food health studies (Le Buanec (ed.) et al., 2012; Meemken & Qaim, 2018; Pointereau, 2019).
We show here that more vegetarian like diets have lower territorial and carbon footprints than food from Organic and Low-input farming. Special attention is also to be given to rice production and livestock, as their methane emissions represent 65% of net GHG emissions reported under of agriculture in National GHG Inventories. Livestock, although providing just 18% of calories and 37% of proteins, occupies 83% of world farmland and emits 58% of agricultural net GHG (Poore & Nemecek, 2018).
How should public policies, in particular International Cooperation programs and the future 2023-27 EU Common Agricultural Policy, be reoriented to meet UN targets? And finally, which kind of research programs should be supported internationally to make diets more compatible with the challenge of providing enough healthy food and achieving zero net emission? We deal here with these issues on the basis, inter alia, of the evolution of global and per capita food demand (of total and animal calories and of cereal equivalent) in different sub-regions of the world up to 2050, on land availability and on possibilities to further increase land-use efficiency (total annual biomass production per hectare).
2831. Low-input and Organic farming versus Conventional and Smart Farming
1.1. Mineral fertilization
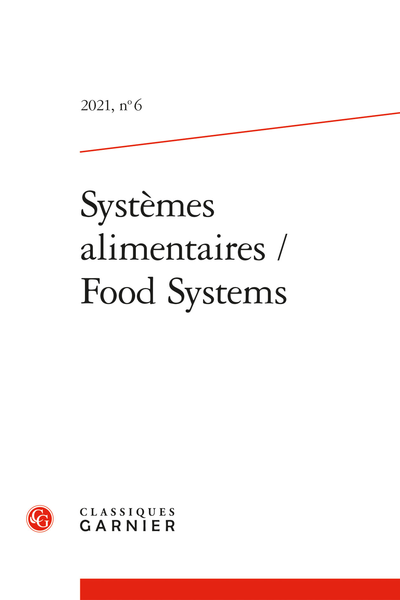
The minimum fertilizer input per hectare, recommended by the 2006 Abuja Conference was 50 kg, to be reached in Sub-Saharan Africa by 2015 (IFDC, 2006). Below that level we consider that we have low-input farming (Fig. 1). Since 2013 there have been no significant changes, except that in 2017 average input per hectare was 140 kg instead of 120 kg at the world level, 500 kg instead of 364 kg in China, and 290 kg instead of 208 kg in Bangladesh (but in the latter case often with more than one crop per year). In 2017 average input in S.S.A. (Sub-Saharan Africa) was still only 16 kg per hectare: 6 times less than in “Middle East & North Africa” region, 8.5 less than the world average input, in “OECD” and in “Latin America & Caribbean” region (W.B., 2021). With too low and too high fertilizer input, evolution of soil quality ought to be regularly checked.
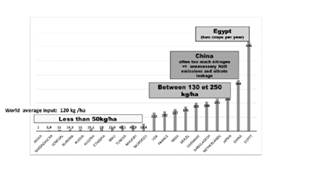
Fig. 1 – Average annual fertilizer consumption per ha of utilized agricultural land in different countries of the world in 2013. Bangladesh is a noticeable exception among Developing Countries (based on W.B. data, 2013).
2841.2. Organic fertilization
In organic farming, synthetic fertilizer and chemical pesticides are prohibited. Pest/weed can only be controlled through mechanical/biological/ thermic measures. Up to the 1950s, average organic and synthetic nitrogen input per hectare were low, everywhere in the world: only about 10 kg in Europe and 5 kg in the US (Fig. 2).
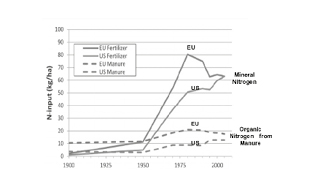
Fig. 2 – Average input of minerals and organic (from the farmyard) nitrogen per ha during the 20th century in Europe and the United States (from Grinsven et al. 2015). Do notice that average inputs per ha of mineral nitrogen are higher for cereals (Riedacker, 2008) and much lower for grassland.
This changed after 1950: in the EU average mineral nitrogen input peaked at 80 kg per ha at the second oil shock. After that cereal yields continued to increase up to 2000, but with a little less fertilizer per ton of grain. But for high yields, e.g., 8 t.ha-1 of grain with 11% protein content, 180 units of nitrogen per ha are still needed (Charmet et al., 2016).
In S.S.A. average nitrogen input per hectare is today still very low: less than 10 kg from manure, 20 kg from symbiotic fixation and but 15 kg from synthetic nitrogen input in 2015 (Elrys et al., 2019). This explains why cereal yields have hardly increased since 1961 (Fig. 3). Nitrogen fixing species can slightly improve nitrogen supply but are largely insufficient 285to produce enough staple food. To reach self-sufficiency of maize by 2050, inputs should reach between 40 kg and 60 kg per ha (ten Berge et al., 2019). The necessity of combining different sources of nitrogen is well understood for instance by farmers in Rajasthan, in India: in their irrigated wheat fields they rely both on synthetic nitrogen, on manure and on nitrogen fixed by acacia. We may call that “smart agroecology” as opposed to “low input agroecology”. Producing more manure would request to increase livestock and therefore GHG emissions. But due to the zed-zed fly this is not possible in subtropical forested Africa. It is therefore completely impossible to replace synthetic nitrogen by organic nitrogen in staple food production in Africa without either provoking huge famines or large-scale deforestation.
1.3. Yield and Territorial and Carbon Footprint
of vegetable products
We do consider here only territorial and carbon constraints for staple food production (wheat, maize and rice) that occupy the largest part of cropland. Today certified organic farming occupies less than 1% of agricultural land of the world. In developing countries organic farming is limited to traditional export crops, such as coffee and tea (Meemken & Qaim, 2018) or olives. In the EU and in France organic farming occupies respectively 7.5% and 7% of total Used Agricultural Area (Eurostat 2018). In France, organic commercial gardening and fruit crops occupy only 2% of agricultural land, 23 times less than grain production.
In France average yield per ha of organic soft wheat reached but about 3.84 t in 2010 (Glachant, 2016), about half-average yields of conventional or smart farming (Table 1, in the Appendix). Some overly optimistic promoter of organic farming consider that such yield gaps may disappear by 2050, whereas others think that by upscaling organic practices this gap is likely to increase (Meemken & Qaim, 2018).
At present average cereal yield in Sub-Saharan Africa are much lower than in any other part of the world due to too low-input or no-input of mineral fertilizer (Fig. 3 and 1). But they could be considerably increased by using more synthetic fertilizer.
286
Fig. 3 – Evolution of average cereal yields, in tons per ha, in different regions of the world and in France, between 1961 and 2014. Do notice that with double cropping, e.g., in South Asia, annual yields indicated in the figure are to be doubled to get total annual production per hectare (Riedacker, 2017 based on French and W.B. data).
Below (Fig. 4), we show the consequences of producing the same quantity of cereal, with Smart farming and Low- or Organic-farming.
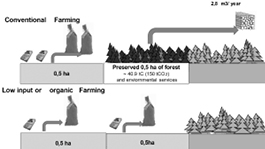
Fig. 4 – Schematic comparison of impacts of Conventional or Low-input or Organic Farming, on deforestation, carbon stock changes1, changes in annual wood production and environmental services (water cycling, soil erosion, biodiversity) when the same total quantity of grain is to be produced.
287Table 1 (in the Appendix) shows differences of territorial and carbon footprints of different cereals obtained from different farming systems in different countries. The number of persons that can be fed per ha (column 3) with low input farming is considerably lower than with present conventional and smart farming: about 4 times less in France, between 3.5 and 4.7 less in Africa, and 10 times less in India. Column 6 shows how much more land (e.g., conversion of forestland and grassland into cropland) is needed to feed as many people as with the smartest farming systems in each group.
In France, less than half as many people can be fed per hectare of cereal with organic farming; and GHG emissions, not per ha, but per ton of grain are higher than with Smart farming. To produce 8 t of grain per ha (allowing feeding annually 3.25 more people per hectare in OECD countries than organic farming) would request more than twice as much land (+ 1.222 ha, column 5) and reduce annual wood and grass production by 4.89 tons of air-dry mass (4.15 tons of dry matter), which could previously potentially mitigate annually 5.47 tCO2e.
Table 1 also shows that even with smart farming (fertilizer and two mid-season drainage), emissions are 1.6 times higher per ton of rice than per ton of wheat.
1.4. Carbon footprint of livestock products
According to FAO and Malassis, on average 7 vegetable calories are necessary to get 1 animal calorie. And ruminant meat has a high carbon footprint: 15.6 kgCO2e per kg of carcass weight of meat from dairy cows and bulls, and 20.2 kgCO2e per kg of carcass weight of fattened calves. It is therefore important to also consider the kind and amount of total and animal protein intake per capita and per country (Fig. 5).
2882. Evolution of food demand globally
and by sub-regions of the world up to 2050
2.1. Evolution of calorie and cereal equivalent demand
per capita, up to 2050, in different world-subregions
According to Le Cotty et Dorin (2011), world calorie demand is to increase by 36% between 2003 and 2050. To become carbon neutral, much more biomass is, however, to be produced to replace fossil fuel, to increase carbon stocks or to absorb CO2 from the atmosphere with bioenergy carbon capture and storage (Hertel et al. 2016; IPCC, 2019).
With unchanged diets between 2003 and 2050 (Table 2, in the Appendix), calorie demand is to increase by 142% in Sub-Saharan Africa, by 70% in “Middle-East North-Africa”, by 56% in Asia (without China), by 9% in OECD countries, and by 6% in China.
2.2 Protein and meat consumption
in different world subregions
According to Fig. 5, average daily total protein consumption per capita in India in 2009 met just the daily minimum of 50 g, with only about 12 g of animal protein (including milk and milk-derived products). Whereas in the United States, Canada and the European Union, total protein consumption was already almost twice the daily need per capita: animal protein consumption already reached 115 g., about 65% of total protein consumption. In the latter group of countries, total protein consumption per capita can be reduced by 30% and animal proteins be divided by two. This would drastically reduce the territorial and carbon footprint of per capita diets.
289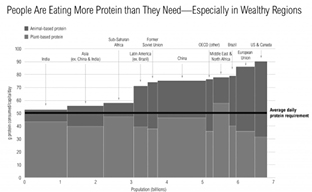
Fig. 5 – Total, animal and vegetable protein consumption
in different regions and countries (World Resources Institute, 2009).
2.3. Carbon footprint of diets
Pointereau (2019) considers that annual carbon footprints of per capita diets in France are directly influenced by the quantity of meat consumed: 1.8 t CO2e, 1.4 t CO2e and 2.6 t CO2e respectively for average, low (less than 50 g per day) and high meat (more than 100 g per day) consumer. It is therefore important to notice that average annual meat consumption per capita in 2017 was less than 60 kg in Romania, China and Vietnam, 87 kg in France, 100 kg in Brazil and 124 kg in the United States (OWID).
Final emissions per capita depend not only on the type of staple food consumed, but also on the diet and on the quantity of food consumed. In 2015, the average consumption of cereals per capita was about 266 kg (92 kg of soft wheat, 7.6 kg of rice and about 166 kg of cereals in feed) in France and 173 kg (98 kg of rice and 65 kg of wheat and about 10 kg in feed) in India. Consumption of milk reached respectively 241 kg and 84.5 kg and that of meat 87 kg (out of which 23.1 kg ruminant meat) and but 4 kg (probably mainly from ruminants) in India.
290Based on these figures and on Table 2, when considering but cereal, milk and ruminant meat consumption, emissions per capita reached about 685 kgCO2e in France, versus about 225 kgCO2e with smart farming and 483 kgCO2e with conventional farming in India. This also shows the importance of farming efficiency in milk, wheat, and rice production.
3. Conclusions for different regions
in the world
According to FAO et al. (2020), the highest prevalence of undernourishment, and projected for 2030, is in S.S.A. (21% in 2018 and 29% in 2030), and in Southern Asia (13.8%, to come down to 9.5% in 2030, close then to the world average). Without the Green Revolution, India would have today a much higher percentage of mal-nourished people.
In 2016 average arable land per capita was about 0.09 ha in China, 0.12 ha in India, East Asia, and Sub-Saharan Africa, 0.19 ha in the World and Europe, 0.21 ha in Latin America, but 0.28 ha in France, 0.39 ha in Brazil, 0.55 ha in North America and 0.85 ha in the Russian Federation (W.B.). And in 2011 the share of global habitable land which would have been required for agriculture if everyone in the world adopted the average diet of a given country, would have been only 25% with diets of India, Bangladesh and most Sub-Saharan African countries, 50% with Chinese diets, close to 100% of German and Portuguese diets, about 125% with US, French, and Brazilian diets, and above 150% for New Zealand, Argentinian and Australian diets (OWID).
3.1. Asia, without China
In South Asia, with two crops a year on the same land, average cereal yields reach 6,4 t per ha (Fig. 3). And in Indo-Gangetic Plains, annual yields of cereals (rice + wheat) per hectare are even higher, comparable to those in France. Like in other countries, it is not possible to find enough organic fertilizer for staple crops. Organic crops occupy therefore only 2% of Agricultural Land. Generalizing organic or low input farming 291would probably divide present annual cereal production (263 million metric tons in 2019) by 2 and therefore for the total production to remain constant, need an additional area of 99 Mha of cropland. But today already about 60% of national land is occupied by crops and there is hardly any land available to increase that area. Moreover 54% of the country is already facing high, to extremely water stress. India is also in the top 3 countries concerned by sea-level rise which will diminish agricultural land, although less than in Bangladesh. There are 80,7 Mha of forest, at about 22% of national land. But both for environmental and economic reasons it is impossible to replace them with cropland: Indian wood production is already insufficient and in 2007 and 2017 the country had to import wood and wood-derived products respectively for $ 1,37 billion and $ 2,19 billion. Despite the decreasing number of children per women (6 in 1960 and 2.24 in 2017), Indian total population is still to increase from 1,31 billion in 2017, up to 1.66 billion in 2050. In 2003 diets per capita, total food demand is to increase by about 50% between 2003 and 2050 (Table 2, in the Appendix)!
To optimize crop yields, using high levels of mineral input is therefore inevitable. Adopting low input or organic farming practices for staple food production would induce huge famines, as average food consumption per capita, mostly of vegetarian type, is today still low, at least from a western point of view. To avoid provoking huge food shortages by switching to low input or organic farming would either need increasing massively staple food importation (requesting increasing land-use efficiency or large deforestation and conversion of grassland elsewhere), or massive migrations!
3.2. Middle East and North Africa
In 2003 diets, food production is to increase by 70% between 2003 and 2050 in that subregion. Today, except Turkey that is self-sufficient in cereal production, one calorie out of two consumed in 2011 in North Africa was imported (Le Moët & Schmitt, 2015). And the population is still to increase, whereas climate change is likely to reduce yields. In Egypt, average fertilizer consumption per ha is today already very large (Fig. 1), and double cropping very common. Despite that, the country is to import annually 11 million tons of cereal, which makes it the 292largest soft wheat importing countries. And this will not diminish, as its population is to increase from 100 million people today, up to 150 million in 2050! Switching to low or organic staple food farming in this sub-region is therefore completely unimaginable.
3.3. Sub-Saharan Africa
Contrary to the two previous subregions, deforesting is still possible in Africa: it reached annually 1,5 Mha for agriculture (FAO, 2020) that emitted at least 450 MtCO2, about as much as France and a tenth of EU27 total annual GHG emissions. Increasing cereal yield from 2 to 4 tons per ha (Table 1) would avoid emitting about 300 tCO2e per ha, at a cost of 6 €/tCO2e per year, between 2020 and 20502 in a country like Benin. According to van Itersum et al. (2016), with yield gap closure alone – that supposes not only to use improved seeds but also more fertilizer – will anyhow not be feasible to meet future S.S.A. cereal demand, which is to triple by 2050, in existing production areas. But at least it would reduce the need for land use change. Climate change may also worsen the situation. Agricultural practices in Africa are therefore also to be modernized to increase climate change resilience (Riedacker, 2020). Staying with low input farming would neither help to feed adequately that sub-continent, nor to make it more climate-friendly. It would also exacerbate local conflicts for land, intra-African migration, and to a lesser degree intercontinental migration.
3.4. Latin America
Latin America has huge areas which can technically be converted into cropland. But this would also not be climate-friendly. Contrary to Africa, animal protein consumption per capita (Fig. 4), territorial and carbon footprints per capita can be reduced.
2933.5. Europe and North America
North America and Europe are the highest, per capita, GHG emitting countries in the world. But here animal protein and calorie consumption could theoretically be reduced by a third and meat consumption be divided by two. Doing this would significantly reduce the territorial and carbon footprint. Whereas promoting organic or low input farming would drastically increase land use change and GHG emission (Fig. 4). In France it would request deforesting more than 9 Mha out of 16.9 Mha (more than half of French forests), reduce annual wood production for energy, pulp and paper and buildings by about 50 million m3, decrease carbon stocks of forests and grassland emitting thus, at least, 1800 MtCO2 (about 4 times net total annual GHG emission of France in 2017). It would also reduce environmental services of forests and grassland. Moreover, it would also prevent finding enough land areas to plant trees to compensate GHG emissions from other sectors and from livestock. Recently the French Academy of Agriculture came to the same conclusion: “Generalizing organic cereal production in France would request 9 to 10 million additional hectares. This could only be achieved at the expense of permanent grassland, wet areas, and forests” (Regnault-Roger et al., 2018).
3.6. At the global scale
Modeling studies of Hertel et al. (2016) suggest that with policies in place in 2015, and a climate stabilization scenario (450 ppm in 2050), global crop demand due to population growth and additional demand for biofuels may increase respectively by 16.2% and 40.5%, e.g., need 231 and 312 million hectares additional land. This would also increase the demand for fertilizer. But as organic fertilizer is today already insufficient, generalizing organic farming is clearly not a realistic and recommendable option.
2944. General recommendations
4.1. General recommendations
In a globalized world, staple food production with organic or low input farming practices is totally incompatible with countries that have decided to eradicate hunger and to achieve carbon neutrality by 2050. It would end up, either in huge deforestation and massive GHG emissions, or with huge famines. This is usually unknown by fora and non-specialized media and by consumer wanting but to consume more healthy food, and who very often unfortunately believe that organic staple food “is good for the planet”! Land use efficiency, e.g., total annual food and non-food biomass production per unit of land, and not just yields per ha, are to be optimized everywhere in the world, e.g., to be maximized by considering limitations due to local environmental, social, and economical constraints.
4.2. To reduce diet footprints
All smart agronomical practices, such as reduction of fallow periods, intercropping, cropping intensity, smart agroecology (as opposed to low input agroecology), rainwater harvesting, drip irrigation, fractioning of nitrogen input, etc., should therefore be considered in each country and each region. There is, of course, no one fit solution, but the direction to adopt is clear. And it cannot be to go for Low-input or Organic staple food farming: it would widen the present emission gap reported by UNEP (2019). And in some parts of the world, it would even increase malnutrition and/or massive intra and intercontinental migrations.
4.3. To produce more healthy food
Producing “low meat diets”, or “more vegetarian like diets” from conventional farming in affluent countries, as healthy, as supposedly more organic-like food (AFSAA, 2003) needs to be much more seriously documented to prevent impracticable public recommendations, anyhow incompatible with the presently global and common objectives at the UN level! Baudry et al. (2019) showed positive health effects of more organic 295diets. But the cohort of consumers with more vegetarian diets (e.g., “low meat diets” or “lower ruminant meat diets”) from conventional or smart farming practices was missing in their study. Further investigations on health impacts of phytopharmaceutical products and residues, by public entities (for instance by the EU joint research center at Ispra) should therefore also be supported, as this is still a controversial issue (Jouzel, 2019). Alternative production techniques, such as those experimented by the « zero-pesticide residues » group should be supported. Aspiring to become a champion in fighting climate change, the EU should refrain from promoting low input or organic staple food farming in the next 2023-2027 program of the Common Agricultural Policy. Increasing organic farming area from 8% up to 25%, as planned in the EU (Bascou, 2021), would probably make only sense for natural grassland, like in Australia that has the largest area of certified organic land area, but mostly of extensive grassland!
4.4. Changing international cooperation of rich countries to reduce GHG emissions in Sub-Saharan African and Least Developed countries by co-subsidizing agricultural input
In article 3 of the 1992 UNFCCC (United Convention Framework Convention on Climate Change) countries agreed to “protect the climate system for the benefit of present and future generations of humankind, on the basis of equity and in accordance with their common but differentiated responsibilities and respective capabilities. Accordingly, the developed country Parties should take the lead in combating climate change and the adverse effects thereof(…)”. And “especially developing country Parties, that would have to bear a disproportionate or abnormal burden under the Convention, should be given full consideration.”
In the past, before Climate Change concerns, charitable NGOs, governments, and the WFP helped developing countries to become less food insecure, only for humanitarian or geopolitical reasons. But today all countries are to reduce world GHG emissions at least costs. Burney et al. (2010) did estimate that each dollar invested in agricultural yields has resulted in emissions reduction at a cost of about $ 4/tCO2e. Above we showed that reducing deforestation for crops in Africa by increasing cereal yields costs annually but 6 € per ton of avoided CO2, up to 2050. This is to be compared with carbon taxes per ton of CO2: 29644.6 € in 2020 in France, which was to reach 86.2 € by 2022; 115 € in Sweden; and some future much higher carbon taxes that some economists consider as inevitable to reach carbon neutrality by 2050. But as, unlike OECD countries, most Least developed and S.S.A. countries are unable to support their farmers at the level that would be sufficient (Fig. 1), rich countries should now, for selfish reasons, co-subsidize agricultural input in countries with less than 50 kg, (about a third of 2017 world average) fertilizer input per hectare (Riedacker, 2018). This would be one of the least-cost options for rich countries, while allowing at the same time to produce more food and thus reducing future famine risks and emigration needs. Similarly, other actors wanting to compensate their incompressible GHG emissions with tree plantations should also contribute to that co-funding.
Conclusion
In 2007, Kofi Annan, former General Secretary of the United Nations Organization called for a Green revolution in Africa. So did also Agra, an NGO sponsored by Bill Gates and supported by the World Bank. In 2006, Jacques Diouf, Director General of the FAO, called for “a second Green Revolution” to feed the world’s growing population while preserving natural resources and the environment. “The original Green Revolution of the Fifties and Sixties doubled world food production by bringing the power of science to agriculture, but “relied on the lavish use of inputs such as water, fertilizer, and pesticides. The task ahead may well prove harder,” he continued. “We not only need to grow an extra one billion tons of cereals a year by 2050 – within the lifetimes of our children and grandchildren – but do so from a diminishing resource base of land and water in many of the world’s regions, and in an environment increasingly threatened by global warming and climate change.” These Appeals, Statements, and Challenges highlighted before the 2015 Paris Agreement are still valid today. Promoters of agro-ecological practices – for instance Bernard Hubert and Denis Couvet (2021), as well as members of International NGO’s, like Aubert et al. (2019) 297from IDDRI (Institut du Développement Durable et des Relations Internationales) – are trying to find out how present farming systems can be improved, but in Europe. Whereas other International NGOs, like IFSDAA (International Foundation for Sustainable Development in Asia and Africa), are considering these issues in countries where this task is far much more difficult. But after the ratification of the 2015 Paris Agreement on climate and the adoption of 2015 UN SDGD’s, both developed and developing countries and entities, like the EU, wanting to combat climate change, should now revisit this issue of land use at the global level, which has been up to now neglected. We are now, in our highly interconnected world, to consider the consequences of recommendations for food diets and agricultural practices, not only in each country or group of countries, but also globally. The issue of land use deserves therefore now much more consideration than up to now, both in international climate negotiations and financing.
298References
Adjahossou F., Adjahossou S., Adjahossou V.N., 2009, « Aspects nutritionnels de l’optimisation d’un système de culture associant le maïs et l’arachide au Sud Bénin », Biol. Chem. Sci., 3(5): 1141-1150.
Aubert P.-M., Schwoob M.-H., Poux X., 2019, “Agroecology and carbon neutrality in Europe by 2050: What are the issues? Findings from the TYFA modelling exercise”, IDDRI Studies, no 2, April 2019.
AFSSA, 2003, Évaluation nutritionnelle et sanitaire des aliments issus de l’agriculture biologique, Association française de sécurité sanitaire des aliments, juillet 2003, 164 p., www.afssa.fr.
Bascou P., 2021, « Les nouvelles stratégies européennes (Green Deal, Farm to Fork, Biodiversity 2030) et leurs implications pour la PAC », Commission Européenne, Académie d’agriculture de France, 13 Janvier 2021.
Baudry J., Pointereau Ph., Seconda L., Vidal R., Taupier-Letage B., Langevin B., Allès B., Galan P., Hercberg S., Amiot M.J.J., Boizot-Szantai C., Hamza O., Cravedi J.P., Debrauwer L., Soler L.G., Lairon D., Kesse-Guyot E., 2019, “Improvement of diet sustainability with increased level of organic food in the diet: Findings from the BioNutriNet cohort”, American Journal of Clinical Nutrition, American Society for Nutrition, 109 (4), p. 1173-1188. <10.1093/ajcn/nqy361>. <hal-02487493>.
Burney J., Davis S., Lobel D., 2010, “Greenhouse gas mitigation by agricultural intensification”, Edited by G. Philip Robertson, W. K. Kellogg Biological Station, Hickory Corners. https://www.pnas.org/content/107/26/12052 (consulté le 13/07/2021).
Charmet G. et al., 2016, Agriculture et alimentation durables: trois enjeux dans la filière céréales, Quae, 125 p.
Diarra A., Riedacker A., 2017, « Synergies entre récupération des eaux de ruissellement et fertilisations minérales dans les pays sahéliens, pour accroître la sécurité alimentaire, faire face à la croissance démographique, s’adapter aux changements climatiques et limiter les émissions de GES », Journal of Water and Environnemental Sciences.
Diouf J., 2006, “FAO Director-General appeals for second Green Revolution”, FAONewsroom, 13 September, Rome/San Francisco. http://www.fao.org/newsroom/en/news/2006/1000392/index.html (consulté le 13/07/2021).
Elrys A., Abdel-Fattah M., Raza S., Chen Z., Zhou J., 2019, “Spatial trends in the nitrogen budget of the African agro-food system over the past five decades”, Environ. Res. Lett., 14, 124091.
299FAO, 2011, International Scientific Symposium Biodiversity and sustainable diets United against hunger, Rome, 3-5 November 2010.
FAO, IFAD, UNICEF, WFP, WHO, 2020, The State of Food Security and Nutrition in the World 2020. Transforming food systems for affordable healthy diets, Rome, FAO.
Glachant C., 2016, Fertilisation du blé biologique: synthèse d’essais menés en France 1995-2014, Chambre d’agriculture de Seine-et-Marne, 21 p.
Grinsven H., L. Bouwman, K. Cassman, Van Es H., McCrackin M., Beusen A., 2015, “Losses of ammonia and nitrate from agriculture and theirs effect on nitrogen recovery in the European Union and the United States between 1900 and 2050”, Journal of Environmental Quality, 44(2), p. 356-367. http://dx.doi.org/10.2134/jeq2014.03.0102 (consulté le 13/07/2021).
Hertel T., Lantz U., Baldos C., 2016, “Global Change and the Challenges of Sustainably Feeding a Growing Planet”, Springer, 184 p.
Hubert B., Couvet D (éd.), 2021, La transition agro-écologique: quelles perspectives en France et ailleurs dans le monde, 2 tomes, Académie d’Agriculture de France, Presses des Mines.
IFDC, 2006, “International Conference of the International Fertiliser Development Center”, Abuja 9-16 June 2006,Abuja declaration. www.ifdc.org.
IPCC, 2019, “An IPCC Special Report on climate change, desertification, land degradation, sustainable land management, food security, and greenhouse gas fluxes in terrestrial ecosystems”, Summary for Policy Maker.
Jouzel J.-N., 2019, Pesticides: comment ignorer ce que l’on sait, SciencesPo/Les Presses, 261 p.
Kofi Annan, 2007, « Pour une révolution verte en Afrique », Le Monde, 10 juillet.
Le Buanec B. (éd.), 2012, Le tout bio est-il possible? 90 clefs pour comprendre l’agriculture biologique, Paris, Quae, 240 p.
Le Cotty T, Dorin B., 2012, “A global foresight on food crop needs for livestock”, Animal, vol. 6, issue 09, p. 1528-1536.
Le Mouël C., Schmitt B., 2017, La dépendance alimentaire de l’Afrique du Nord et du Moyen Orient à l’horizon 2050, Quae, 144 p.
Meemken E., Qaim M., 2018, “Organic Agriculture, Food Security, and the Environment”, Annual Review of Resource Economics, 10:1, p. 39-63.
National Communications to UNFCCC (for France https://unfccc.int/documents/64738 and for India https://unfccc.int/resource/docs/natc/indnc2.pdf).
OWID, Ourworldindata, https://ourworldindata.org/agricultural-land-by-global-diets (consulté le 13/07/2021).
Patak H., Li C., Wassmann R., 2005, “Greenhouse gaz emissions from Indian rice fields: Calibration and upscaling model using the DNDC model”, Biogeoscience, 2, p. 113-123.
300Pointereau Ph., 2019, « Le revers de notre assiette changer d’alimentation pour préserver notre santé et notre environnement », 62 p. https://solagro.org/images/imagesCK/files/publications/f85_le-revers-de-notre-assiette-web.pdf (consulté le 13/07/2021).
Poore J., Nemecek T., 2018, “Reducing food’s environmental impacts through producers and consumer”, Science, vol. 360, Issue 6392, p. 987-992.
Regnault-Roger C. (éd.), Fougeroux A., Guéguen L., Kressmann G., Le Buanec B.,. Lévêque C, Monnier C., Pascal G., Pernollet J.C., Vialle P., de Tendron G. (préf.), 2018, Idées reçues et agriculture: parole à la science, Académie d’Agriculture de France, SciencesPo / Les Presses, 220 p.
Riedacker A., 2008, “Reconsidering Approaches for Land Use to Mitigate Climate Change and to Promote Sustainable Development”, Chap. 17, Climate Change and Global Warming, Ed. Velma Grover, Oxford IBH Ltd -Science Publisher USA, p. 387-424.
Riedacker A., 2018, “Let us subsidize fertilizer for national food production in Sub-Saharan Africa and Least Developed Countries to stabilize the climate and eradicate hunger”, in Genetic Resources Towards Food, Energy and Environment, Jodhpur, India, Chapter 1, p. 1-37, Proceedings of the 7th International Seminar on Sustainable Resource Management, Edited by R.K Behl, S. Khatodia, M. Kern, W. Merbach, Agrobios International.www.agrobiosindia.com.
Riedacker A., 2020, “A Complementary Analytical Framework to Reach Food-Security by 2030 and Global Equitable Carbon Neutrality by 2050: Preliminary Considerations for Crop and Livestock Management in Different Regions of the World”, chap. 10, p. 167-217, in Trends in Technology for Agriculture, Food, Environment and Health, Jodhpur India, Edited by R. K. Behl, Machiavelli Singh, Achim Ibenthal, Manfred J. Kern, AGROBIOS International, 561 p.
Ritchie H., 2007, “How many people does synthetic fertilizer feed”, November 07.
Sapkota T. et al., 2020, “Identifying optimum rates of fertilizer nitrogen application to maximize economic return and minimize nitrous oxide emission from rice–wheat systems in the Indo-Gangetic Plains of India”, Archives of Agronomy and Soil Science, 66:14, p. 2039-2054.
Ten Berge H.F.M., Hijbeek R., van Loon M.P., Rurinda J., Tesfaye K., Zingore S., vanHeerswarten J., Bentrup F., Schrâder J.J., Boogard H.L., de Groot H.L.E., Van Ittersum M. K., 2019, “Maize crop nutrient input requirements for food security on sub-Saharan Africa”, Global Food Security, vol. 23, December, p. 9-21.
301Toqué C., Afsaneh-Lellahi V., Tailleur A., 2012, « Le blé tendre une production durable », Colloque Service Agronomie Économie et Environnement, Institut du végétal, Arvallis, février 2012, 14 p.
UNEP, The emission gap report 2019, 63 p.
Van Ittersum M.K. et al., 2016, “Can sub-Saharan Africa feed itself?”, Edited by R.J. Scholes, University of the Witwatersrand, Wits, South Africa.
WB, World Bank data.
WRI, World Resources Institute.
302APPENDIX 1
Territorial and Carbon Footprints of cereals with different farming systems in France, in the West African coastal zone, in the Sahel, and in India (GHG emissions based on IPCC methodology,2006)
|
1 |
2 |
3 |
4 |
5 |
6 |
|
Farming system and fertilizer input |
Yield |
Number of people that can be fed per ha |
Territorial and (Carbon) footprint per Capita |
Territorial and (Carbon) footprint per ton of cereal |
Additional land area needed to feed as many people as with Smart farming in each group* |
|
t. ha-1 |
N |
ha per capita |
ha.t-1 |
ha |
|
|
Soft wheat in France in 2008-2010 |
|||||
|
Smart farming *a |
8 |
6.95 |
0.144 |
0.125 |
- |
|
Organic farminga |
3.6 |
3.13 |
0.319 |
0.278 |
+1.222 |
|
Maize in African Coastal Zone (Benin) in 2002-2003 |
|||||
|
Smart farming*b |
4.77 |
17.48 |
0.057 |
0.210 |
- |
| 303
Improved maize |
1.5 |
4.54 |
0.22 |
0.667 |
+1.96 |
|
Non improved maize |
1 |
3.03 |
0.330 |
1 |
+3.77 |
|
Maize in the Sahel (Burkina Faso) in 2012-2014 |
|||||
|
Smart farming*c |
2.8 |
8.48 |
0.097 |
0.357 |
- |
|
Without fertilizer |
0.8 |
2.42 |
0.341 |
1.25 |
+2.5 |
|
Rice in India |
|||||
|
Smart farming*d (Experiments in 2005) |
7.075 |
17,485 |
0.057* |
0.141 |
- |
|
Average in 2017e |
2.494 |
6.16 |
0.162 |
0.401 |
+1.83 |
|
Average in 1950 |
0.668 |
1.65 |
0.606 |
1.497 |
+9.59 |
*reference in each group; aToquet et al., 2012; bAdjahossou et al., 2009; cDiarra et Riedacker, 2017; dPatak et al., 2005; eSapotka et al., 2020.
304Appendix 2
Evolution, between 2003 and 2050, of average energy consumption per capita (total, vegetable
and animal calories, and in cereal equivalent) with different diets in different world sub-regions
(based on Le Cotty & Dorin, 2012)
|
World |
Sub-Sahara Africa |
Asia without China |
Middle East North Africa |
China |
Latin America |
Former Soviet Union |
OECD Countries |
|
|
Daily calorie-demand per capita in 2003, in kcal per day |
||||||||
|
Total calories |
2985 |
2353 |
2593 |
3340 |
3017 |
3215 |
3250 |
3908 |
|
Animal calories in % of total consumption |
17 % |
6 % |
8 % |
10 % |
19 % |
18,5 % |
20 % |
30 % |
|
Annual consumption per capita in kg Cereal Equivalent (kgCE) in 2003 |
||||||||
|
Total |
623 |
330 |
405 |
564 |
678 |
699 |
754 |
1150 |
|
% of OECD countries |
54% |
29% |
35% |
49% |
59% |
61% |
66% |
100% |
|
Animal calories in cereal equivalent % of total calories |
58% |
30% |
38.5% |
45% |
62% |
62% |
64% |
75% |
|
Increase of total calorie-demand in 2050 with 2003 unchanged diets |
||||||||
|
36 % |
142 % |
51 % |
70 % |
6% |
47 % |
-16 % |
9 % |
|
|
Increase of total calorie-demand in 2050, but with completely vegetarian diets |
||||||||
|
8 % |
114 % |
40 % |
23 % |
-14% |
4 % |
-45 % |
-35 % |
|
1 In European countries a mixed land use change (1/2 forest land and 1/2 grassland) emits on average about 200 t of CO2 per ha, and much more under the tropics with deforestation of virgin forests. We assume here that the production of 1 t of air-dry biomass contains 0.35 toe of primary energy and has mitigation a potential of 1.12 tCO2e. An average production of 4 t of air-dry biomass per ha as considered here, contains 1.4 toe that can mitigate 4.48 t of CO2e, for instance from fossil fuel, if used as efficiently as petrol for heat generation, and a little less if used to feed mono-gastric, e.g., human beings, horses, chicken, rabbits, etc. When used by ruminants, methane emissions which depend on livestock management, are also to be considered (Riedacker, 2020).
2 Increasing cereal yield, from to 2 to 4 ton per ha (Table 1) would avoid to deforest 1 ha emitting about 312 tCO2e when converted into cropland and increase emissions from input but by about 0,38 tCO2e.ha-1.year-1, (~11.4 tCO2e in 30 years) thus avoiding emitting 300 tCO2e at a cost 60 € per ha.year-1, 1800 € in 30 years, e.g., 6 €/tCO2e.year-1, per ton of avoided CO2 emissions, assuming a fertilizer cost of 30 € per ton of wheat, like in France.