Importance de l’engagement durable des managers pour la certification des vins
- Type de publication : Article de revue
- Revue : Systèmes alimentaires / Food Systems
2021, n° 6. varia - Auteurs : Alonso Ugaglia (Adeline), Cardebat (Jean-Marie), Dupuy (Louis), Sloop (Savanna)
- Résumé : Cet article analyse le rôle de l’engagement des managers pour l’adoption de certifications environnementales et durables dans la filière vitivinicole. Une analyse théorique, basée sur une revue de la littérature et une approche par les parties prenantes, fournit le cadre conceptuel permettant d’estimer la probabilité d’adopter de telles certifications. Les régressions logistiques montrent que la décision est motivée en premier lieu par les convictions et l’engagement des managers.
- Pages : 67 à 94
- Revue : Systèmes alimentaires
- Thème CLIL : 3306 -- SCIENCES ÉCONOMIQUES -- Économie de la mondialisation et du développement
- EAN : 9782406127055
- ISBN : 978-2-406-12705-5
- ISSN : 2555-0411
- DOI : 10.48611/isbn.978-2-406-12705-5.p.0067
- Éditeur : Classiques Garnier
- Mise en ligne : 05/01/2022
- Périodicité : Annuelle
- Langue : Anglais
- Mots-clés : déterminant, certification, développement durable, vin, engagement du manager.
Importance of manager convictions
for the adoption
of wine SD certifications
Adeline Alonso Ugaglia
Bordeaux Sciences Agro, INRAE, ISVV, Save
Jean-Marie Cardebat
Université de Bordeaux, Larefi, INSEEC
Louis Dupuy
APESA,
University of Saint Andrews (U.K.)
Savanna Sloop
University of Saint Andrews (U.K.)
Introduction
Like any agricultural and food industry, the wine sector creates environmental and social impacts in wine regions all around the world (Delmas et al., 2008). The environmental concern in this sector doesn’t stop growing because of the intensity in pesticide use in the vineyards among others (Chris and Burritt, 2013). Wine is also a product that is 68traded worldwide and experiencing international competition, while produced by SMEs within a fragmented sector (Alonso Ugaglia et al., 2019). In response to these concerns, but also to increase demand for sustainable products and the profitability of wine firms, the wine sector has seen the development of voluntary eco-certification schemes and labeling programs including specifications in line with sustainable development (SD) (Sogari et al., 2016).
SD and eco-certifications aim to signal the environmental and social attributes of goods. These signals, usually affixed to experience goods like wine, solve the problem of asymmetric information between the seller and the final consumer. They act as a distinctive sign to certify the compliance of the product with a norm or a standard (Dankers, 2003; Hobeika et al., 2013; Smith, 2009) and produce differentiation between products (Giraud-Heraud and Hoffman, 2010). With the rising importance of ecological and social issues, SD and eco-certifications confer a quality of trustworthiness on the wines concerning their reduced environmental and social impact. They signal that a product has been eco-certified for some environmental or SD attributes (Delmas and Grant, 2010). These certifications can address partial or global environmental concerns, or can be linked to sustainable development specifications in line with the triple bottom line approach (UNU-IHDP/UNEP, 2014; World Bank, 2011). Studying wine firms’ SD strategies is particularly interesting as the value of eco-labels is still not clear in this sector (Abraben et al., 2017).
This paper contributes to the literature on the drivers for adoption of SD certifications, exploring the role of the manager personal convictions as a reason why wine firms voluntarily certify their products. Although most research outlines the positive relationship between sustainability and quality (Gabzdylova et al., 2009; Pullman et al., 2010; Warner, 2007), there are still researchers and winemakers who are skeptical about the returns that sustainability provides and the diffusion of eco-labels remains limited (Delmas and Gergaud, 2021). Developing differentiation strategies and profitability would probably not be sufficient drivers (Dodds et al., 2013), no more than incentives from local producers’ organizations (Delmas and Grant, 2010) or from other stakeholders to explain the adoption of SD and eco-certifications. We assume that some other intrinsic factors, like personal convictions 69of the manager as regards environmental concerns or SD, would be of prime importance to explain the commitment of producers. We adopt an empirical approach based on an original survey to contribute to a better understanding of the certification drivers on the producer side in two famous wine regions: Bordeaux and California. We then identify drivers of certification adoption that are tied to SD (Principal Component Analysis (PCA) and logistic regression) and highlight the importance of the managers’ convictions for the SD certification decision. This result is rather original on the wine market, known to be based on the firm image, reputation and marketing.
The paper is organised as follows: the second part presents the theoretical context of the research; the third part details the data; the fourth one focuses on the econometric method and presents the results; the last part concludes.
1. Background and issue
1.1. Wine SD certifications in California and Bordeaux
Due to its ancient history, complexity and economic weight, wine holds an important and unique place in the agricultural industry. But wine is no exception regarding the impact of its products on society and on sustainability issues. SD can be dealt with from different perspectives; from a technical or a productive point of view, as well as from a consumer, a strategic or a metaphysical viewpoint, among others (Jover et al., 2004; Steenkamp, 1990). SD and eco-certifications are acknowledgements that can be obtained voluntarily by firms in order to show that their operations reach certain criteria for sustainable practice (Blackman and Rivera, 2011). In order to receive an SD certification, firms generally select the scheme they wish to certify with and then go through a program to improve their methods of production, or prove to the scheme that they have already done so. We can observe different approaches signal SD quality (Box 1). On one hand, eco-certifications are defined as sustainability-certification schemes and contracts that don’t require the producer to display a label on the product, like Corporate Social 70Responsibility (CSR) or Environmental Management Systems (EMS). On the other hand, eco-labels are wine products that do display a label to the consumer that it is an eco-friendly product (Delmas and Grant, 2010). Eco-labels signal to consumers the environmental attributes of a product or service. “Most eco-labels consist of the adoption of standardized sustainable practices, the certification of these practices by an independent organization, and the communication of the certification through a label placed on the product” (Delmas and Gergaud, 2021). For example, organic and biodynamic labels display the certification of the product to the consumer (commercial objective).
Among these strategies, the organic certification has been identified as the most prevalent and ubiquitous in the wine industry (Moscovici et al., 2020). It is also the most discussed in the literature at the moment. As the traditional segment is leveling off, organic wines are experiencing a favorable dynamic even if still representing a small part of the production. According to OIV, the market share of organic wine, which has been steadily increasing, reached 8% to 12% of world wine production (volumes) in 2015. The organic segment is progressing all over the wine world. Therefore, for the most part, the literature focuses mainly on organic wine consumption (Delmas and Gergaud, 2014; Waldrop et al., 2017). As sustainability concerns go beyond environmental impacts of the production process (Dasgupta, 2009), SD strategies are considered in the paper as a whole including SD and eco-certifications and labels stricto sensu, but also guidelines, voluntary standards and certifications falling within one of the dimensions of SD (economic, social, environmental) (Gilinsky et al., 2015).
Box 1. Different approaches to signal SD and environmental quality of wines
– Organic wines: In Europe, this label describes a wine that meets the 2012 European specifications (JOEU, 2012). The specifications require that the wine comes from a production process that meets the principles of organic farming, both in the vineyard (no pesticides, no GMOs) and in the cellar (organic yeast). Organic wines certified by the United States Department of Agriculture (USDA) also rely on strict regulations. The grapes are grown without the use of synthetic fertilizers or pesticides, and all ingredients going into these wines, which includes yeast, must be certified organic. No sulfites may be added to these wines, although some that occur naturally are permitted, making a difference with European organic wines (sulfites allowed) (Raineau, 2018);
71– Biodynamic wines: Biodynamic wines are organic certified. The specifications include more restrictions as limited use of copper and sulfur. Provided by Demeter association (Europe and the USA). While organic farming methods focus on eliminating pesticides and other additives, biodynamic farming emphasizes creating a self-sufficient and healthy ecosystem (Castellini et al., 2017);
– CSR: Management system based on ISO26000 specifications adapted for different wine industries (Munoz et al., 2021);
– EMS: Management system based on continuous improvement cycle in compliance with international standards for EMS as ISO14001 (Atkin et al., 2012).
California1 and Bordeaux2 are both emblematic wine-producing regions respectively in the New and in the Old World of wine. These two regions develop SD strategies. The first established guidelines for sustainability of wine grape growing in California were published in 2002 after an association of growers had researched and organised best practices for sustainability in the winemaking process in the Lodi region (Zucca et al., 2009). This work led to one of the first certification schemes for wine grape growers (WSC) (Broome and Warner, 2008). Lodi’s WSC focused mainly on ensuring sustainability within the agroecological practices of wine-growing, and led to the development of the California Sustainable Winegrowing Program (SWP) that promoted sustainable practice throughout the entire business process of wine production in the whole area (Broome and Warner, 2008). However, Delmas and Grant (2010) and then the CSWA annual report (2020) shows that the number of SD wine firms being SD certified remains limited despite the incentive provided by the Wine Institute and the California Association of Winegrape Growers.
The Bordeaux wine region has decided to reduce its environmental impact through the setting up of an EMS approach, led and promoted since 2010 by the Bordeaux Wine Council (CIVB) representing all the Bordeaux wine-industry players (358 wine firms certified in 20203). The EMS approach is based on the principle of continuous improvement to 72demonstrate that the local wine industry respects the environment and reduces its impact on it to a maximum throughout the winemaking process. In 2014, the CIVB Forum on Sustainable Development led to the publication of the Bordeaux wine industry’s second carbon footprint report, revealing a decrease of the sector footprint due to improved glass manufacturing practice. They publish their first SD report in 2015, setting a list of “good” environmental and social farming practices adopted in the vineyard. The CIVB is also developing a CSR approach (CIVB, 2020).
The limited number of certified wine firms for SD attributes despite the SD dynamics we observe in these regions, make them particularly interesting places to study the drivers of SD certification and labeling in this industry.
1.2. Drivers of SD certifications in the wine industry
One way for analyzing the drivers for certification consists of differentiating the production-based (supply-side) and consumer-based (demand-side) drivers. In the wine industry, many papers focus on eco-labels (Delmas; 2010; Delmas and Grant, 2010; Delmas and Gergaud, 2014) from a consumer perspective as consumer perception is an important issue to take into consideration when making business decisions (Lockshin and Corsi, 2012). In an ideal business-to-consumer organisation, changes in the product are supposed to be marketed to the consumer in a positive way. That’s why a part of the literature focuses on consumers’ preferences, providing interesting results in the case of SD wines. About consumers’ profiles, Mueller et al. (2011) show that environmental concerns hardly differ between generations but very strongly between markets. Regarding the willingness-to-pay for such wines, Forbes et al. (2009) found that consumer demand for sustainably-produced wine is high and that consumers are willing to pay more for a sustainably-produced bottle of wine. Pérès et al. (2020) analyze consumer preferences for wines with or without sulfites. Raineau et al. (2018) study the impact of information about the naturalness of the wine (especially about the use of sulfites). They found that the environmental attributes of the wines seem to increase the value of the wine concerned and to decrease those of the wines not concerned.
But these results are in stark contrast to other studies (Barber et al., 2009; Vecchio, 2013). It also seems that the numerous existing 73certifications and labels lead to confusion for consumers and exacerbate the imperfect observation of products. This signal proliferation is particularly acute with eco-labels that complement brands in signaling green, lead-free, fair-trade, organic, no child labour and/or low-cholesterol attributes (Marette, 2014). Finally, depending on the studies, having an eco-certification may increase the price of the wine (Delmas and Grant, 2010) and therefore an expected profit, or represent a low WTP of the consumers (Bazoche et al., 2008) or no premium at all (Gabzdylova et al., 2009). Moreover, certifications could have a counterproductive effect and lead to decreases in demand (Sogari et al., 2016).
Finally, the value associated with SD or eco-certification remains unclear as does the reasons why producers would pursue it (Delmas and Gergaud, 2021). There is a lack of understanding why some firms adopt SD or environmental management practices beyond regulatory compliance in this context. The motivations in the decision-making process towards SD and eco-certification in the wine sector still remain to be highlighted, especially on the producer side (Santini et al., 2011; de Steur et al., 2019).
Another approach is the stakeholder one where the drivers are linked to the objectives of the main stakeholders and to the coercive and normative pressure these stakeholders can exert on the company (employees, regulators, environmental NGOs, cooperatives, food industry and distribution, local residents or tourists in wine regions and consumers) (Delmas and Toffel, 2004). In the agricultural sector, according to Padel (2001), the drivers for farming organic certification are rather classified into three different categories: the drivers linked to the farmer (psycho-sociological drivers, specific convictions4, etc.), intrinsic determinants linked to the firm (technical, economic drivers) and exogenous determinants (localization, markets, sectors, etc.). For SD certifications in the wine sector, most of the time, internal drivers of the wine firms (strategy, competition, quality of products, profit expectations) have been highlighted as being more important than external drivers (stakeholder pressure, regulation and consumer demand) for the adoption decision (de Steur et al., 2019; Dodds et al., 2013; Gabzdylova et al., 2009; Pomarici et al., 2015). Jourjon et al. (2016) finally show that the certification of organic wine 74production in the Val-de-Loire region (France) depends on the producers’ environmental convictions (concerning pesticide use to protect vines, soil labour, and the production of wine of good environmental quality) together with internal drivers as economic consideration5.
1.3. Hypotheses
Regarding the previous literature, we assume that the drivers of SD certification might theoretically come from both internal and external drivers, but also from drivers directly linked to the wine firm manager6 (personal considerations and convictions).
The pressure of the market for adopting a SD certification might first come from the consumers. By choosing to shift their purchases towards certified wines rather than non-certified ones, they may create price incentives for wineries to adopt SD certifications. However, according to the empirical literature review, the consumer’s willingness to pay, the higher prices and sales for certified wines are all uncertain. In fact, producers cannot take the decision to certify rationally on the basis of consumers’ expectations. Second, the behavior of the wholesalers and the retailers, and more generally all the players in the distribution channel, might also request a SD certification to sell the wine. As the wine sector is actually quite fragmented and rather organised along long value chains, SMEs suffer from a lack of bargaining power. The pressures may be reinforced by other stakeholders spatially rather close to the wine firms, like neighbours, who want to preserve their living environment. These pressures may induce some constraints on farming techniques.
Some other drivers are tied to the inherent pressure coming from the internal stakeholders (employees, shareholders). But the main part of the time, the capital of wine producing firms comes from the family, meaning that managers are not subject to shareholding pressures. Besides, many producers are engaged in SD without communicating or certifying. That’s why it is important to complement the existing knowledge by considering that managers can also have some SD convictions explaining their involvement in an SD strategy/certification. They can also be 75aware of the sustainable use of the soil, water resource, energy, CO2 emission, etc. Their involvement in an SD strategy would be therefore due to this kind of technical constraint in the long term.
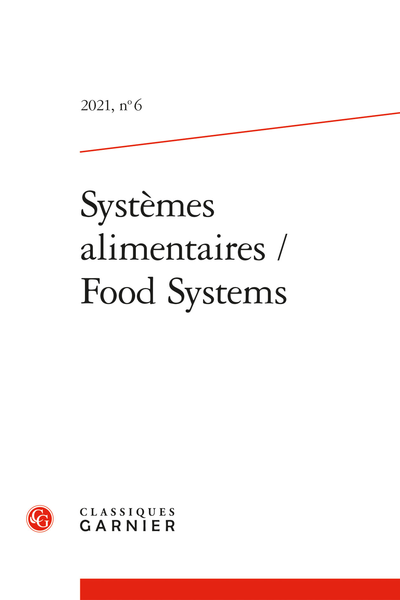
In various manufacturing sectors and different countries, the literature shows the role played by managers in the implementation of CSR policies, whether in SMEs (Sangue Fotso, 2018; Labaronne and Gana-Oueslati, 2011) or in larger companies (Feder and Weißenberger, 2021). Nevertheless, few works concern the wine industry. Alonso Ugaglia (2011) or Jourjon et al. (2016), however, demonstrates that wine managers can influence CSR decisions. Therefore, we find it appropriate pay more attention to the decision drivers of the managers who play with different variables to decide whether or not to certify to meet challenges of SD for in wine industry. Adapting the stakeholder theory (Marshall et al., 2010), we have designed an original approach with the manager being at the core of our representation. Figure 1 constitutes our theoretical approach and constitutes the basis for our empirical analysis considering the different stakeholders through their distance to the decision process. This manager vs. stakeholders’ logic constitutes the proposition we are testing in the paper. In other words, our core hypothesis is that, in the wine industry, the drivers of the SD certification adoption mainly come from the manager convictions, i.e., managers have a greater influence on SD certification adoption than other stakeholders.
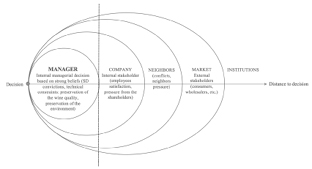
Fig. 1 – The drivers of SD certification. Source: Authors.
762. Data Sample
The survey took place in Bordeaux and California wine-growing regions to gather first-hand information on sustainability from Bordeaux and California wineries. We first conducted face-to-face interviews for testing the questionnaire and then sent questionnaires via emails in both regions. The emails of influential wine professionals were collected from AVA and CIVB webpages where member wine firms are listed. If the emails were not listed, the email was tracked down on the wine firm’s web page. A database of emails and names was compiled and run through mail merge program that automatically sent out emails every day along a period. There is no way to measure the response rate of the survey, as there was no indication of survey completion via email response but from a few individuals. Additionally, the forwarding of the survey by the professional bodies also prevented calculating a correct response rate. When needed, by phone or face to face, we helped the winemakers fill out all the parts of the questionnaire and thereby avoid incomplete questionnaires.
The questionnaire was the same in the two wine regions and was divided into three sections: data on the winery/vineyard (volume of production, sales, range of bottles, etc.), data on the perception of sustainability (practices that matter, target areas of certifications, etc.), and control variables (gender of respondent, number of employees, etc.). It includes 38 questions, with different types of answers (yes/no, multiple choice, Likert scales, etc.). We surveyed 125 wineries, 96 in Bordeaux (France) and 29 in California (the United States of America). In our sample, about 40% of the producers declare having a SD certification (organic for almost all of them). In Bordeaux, 42 wineries are SD or eco-certified, 48 are not, 1 is not certified anymore and the others did not answer the question. In California, the number of certified wineries is 7 against 20 wineries uncertified and 2 did not answer the question. Most respondents consider themselves as sustainability-friendly (83%). To go more deeply into the SD topic, most wine growers view sustainability as a multi-dimensional concept (all dimensions of equal importance for 65% of the wineries). Social sustainability is almost never cited alone. Then, 77if we consider the most important topics according to the producers of our sample, the soil management and the quality of the wine matters the most. The emphasis is mainly on production-based determinants, linked to 3 assets: soils, water, plant protection and biodiversity.
We finally kept only 18 complete questionnaires in California and 83 in Bordeaux, for 101 observations after excluding all NAs (9 questionnaires) and the answer “does not wish to answer” and “non-applicable” to the certification question, with only yes and no left (15 questionnaires). The wineries are located in 12 different sub-regions, 6 in California (California generic, Cameros, Napa, Sonoma, Santa Rosa, San Diego) and 6 in Bordeaux (Bordeaux generic, Sauternes, Saint-Emilion, Blaye, Graves, Médoc). The respondents were people knowing the decision process in the wine firms and having a key role in the firm management. In appendix 1, we present the distribution for all the variables we use.
3. Method
The aim of this section is to estimate the probability to be certified, considering the SD profile of the winery and its main characteristics. Our questionnaire approach, with a comparison of two wine regions and various sub-regions, as well as a large set of control variables, gives us the ability to pin down separately, even if correlated, rationales for certification. Indeed, the goal is to find out which type of variables matters the most regarding our theoretical approach: the manager level, the internal or quasi-internal stakeholders’ level, or the market/demand level. However, a potential drawback of having so many variables lies in having a high serial correlation among these variables. The challenge is then to disentangle the effect of the exogenous variables. For instance, some effects might be due to the region of origin rather than due to the estates’ characteristics. In particular, regions could capture size differences between wineries as well as terroir differences, especially between California and Bordeaux. Regarding this risk of correlation between exogenous variables and, then, the risk of misinterpretation of the results, we use differentiated approaches.
783.1. Three strategies to address
the drivers for SD certification
The first one simply consists in using a robust matrix of variance-covariance for the regression. Indeed, we did not find heteroscedascity in our sample but, as expected, we found serial correlation among the exogenous variables. Therefore, we used the robust variance-covariance matrix proposed by Newey-West (1987) in the first model. We also consider the regions as fixed effect in this regression.
In the second approach, we group our variables thanks to a Multiple Factor Analysis (MFA) as we have both numerical and categorical variables. This MFA is run regarding the theoretical model. The procedure, which is summarized in appendix 2, aims at controlling for the serial correlation of our variables. We regroup our variables in line with our three levels of SD drivers. We first build a multidimensional index (i.e., matching the dimensions of the component analysis) for drivers of the managerial characteristics, then one for the property characteristics and another for drivers associated with the stated importance of our SD drivers (including, for example, soil and water quality). These indexes are based on the subcomponents of our MFA: the first two are based on two Multiple Correspondence Analyses on our qualitative (descriptive) variables, the final one is based on the Principal Component Analysis (PCA) on the Likert scale with it used to assess the importance of SD drivers. Dimension selection for our indexes is based on the eigenvalue criterion assessing added information in the analysis against the addition of random variables. Using this criterion, we have two dimensions in our manager-level characteristics, one synthesising information regarding the manager’s perspective on SD and its status (property or SD manager) and the other mostly driven by the manager’s age range. We then have 3 significant dimensions for the property characteristics: the first associated with property size (through its sales, number of employees and land coverage), the second associated with property pricing policy (with a cross effect of price per bottle and volume), the third associated with properties having a midrange profile in both size and prices per bottle. Finally, the information provided by our Likert scale of SD drivers is summarised in two dimensions: the first dimension is mostly driven by the individual and property commitment to SD (with neighbourhood variables also playing a role) and the second offers a composite gradient of the declared importance of various SD 79issues (energy consumption, greenhouse gases emissions, nitrate in water). We then use these indices (or synthetic variables) from the MFA for our second model, rather than the variable output from the questionnaire. By definition, this strategy reduces both the number of variables and the correlation level between the synthetic variables.
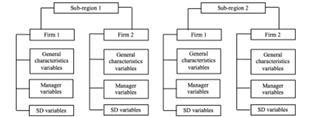
Fig. 2 – Multilevel regression logic (Source: Authors).
The third strategy focuses on the property/region correlation. Indeed, as mentioned, the historical practices, the technological or informational spillovers among the wineries of the same area might explain a correlation between the region/sub-region (appellation) variables and the properties’ characteristics. A way of dealing with this issue is to use a multilevel regression. The logic of this strategy is presented below in figure 2. This third set of regressions is run with the initial variables and with the synthetic variables (as described in the previous paragraph).
3.2. Models
In each case, the models estimate the probability to certify for a winery. We then use a logistical regression:
 (1)
(1)
 is the vector of independent variables, while ɛ is an error distributed by the standard logistic distribution. is divided into two different vectors corresponding to different sets of variables:
 (2)
(2)
With  the variables for the SD profile, i =1, … , n, n depending on the type of variables (issued from the questionnaire or the MFA).
  represents the vector of the k control variables: the size of the winery, region, vision of SD, etc. For each regression, we use a stepwise strategy for identifying the relevant variables (initial or synthetic, depending on the model) in order to obtain the best variance decomposition regarding an Akaike criterion. The results are presented in appendix 3 for the simple-level analysis and in appendix 4 for the multilevel one.
4. Results
Appendix 3 exhibits the result of the simple-level logistical regression. Both models, with the variables coming directly from the questionnaire (model 1) or with the synthetic variables built thanks to an MFA (model 2), provide the same main information: the drivers of SD certification adoption are related to the manager level. Their personal vision of SD and their involvement in SD are crucial for explaining the certification adoption. Neither the influence of the stakeholders nor the market pressure has any significant impact on the probability of adopting a SD certification. In model (1), the main positive and significant variables, excluding the regions, are the individual opinion of the respondent and their strategic role in the winery (i.e., their capacity to influence the strategy). The higher the involvement in SD, the higher the probability to adopt a certification whatever the strategic role of the respondent. Model (2) confirms this result: the respondent profile (SD engaged profile) exhibits a significant positive coefficient. This aggregated profile corresponds to respondents with a highly strategic role, rather young, convinced that the environmental pillar of SD is the most important element and thinking that the property could be better in terms of SD involvement. Furthermore, the conviction on SD outcomes is also a positive and significant variable. Therefore, there is a positive impact on the respondent’s convictions that SD improves the wine quality and the global state of the natural endowments of the 81property, like the soil quality, the water availability, etc. Both models show that some regions are also positively associated with the adoption of SD certifications, especially in the Bordeaux area, but not the whole Bordeaux region (essentially on the right bank).
This outcome is confirmed by appendix 4 which displays the multilevel regressions for models (1) and (2). However, these regressions treat the correlation between properties’ characteristics and regions/appellations differently. The latter disappear, by definition, from the regressions. In this multilevel framework, the size of the properties plays a significant role in the SD certification adoption. The size effect was likely captured by appellation variables in the simple-level regressions. The results show that wineries between 10 and 50 employees have a higher probability to adopt a certification. One interpretation would be that wineries with fewer than 10 employees have fewer resources and, therefore, a lower ability to be engaged in a time-consuming certification process. However, the main result of appendix 4 lies in the role of the personal convictions and involvement of the respondent in SD. The multilevel regression in model (1) confirms the particular prominence of the individual opinion of the respondent. The more the respondent is convinced of the importance of SD and involved in SD, the higher the probability of SD certification adoption by the winery. Besides, model (1) shows that this probability is also higher when the respondent is convinced that the three dimensions – economic, social and environmental – of the SD are of equal importance and therefore has a broad vision of SD (systemic view). Model (2) offers the same results in the multilevel case than in the simple-level case. An SD-engaged profile of the respondent and the convictions that SD can improve the wine quality and endowment of the property are positively associated with the probability to adopt an SD certification.
The message of this study is therefore extremely clear. Whatever the econometric approach, and using a large set of different variables related to all the theoretical drivers, the SD certification of the wineries would be mainly driven by the managers’ convictions. The use of different econometric approaches gives more robustness to this conclusion regarding the high consistency of the results displayed. Considering the previous theoretical assumptions, these outcomes allow for the validation of our core hypothesis. While our empirical strategy does not allow us 82to exclude any strong “demand side” incentives to certification – i.e., market pressures – we find no particular evidence supporting this view. Neither do we find any evidence supporting a leading role for internal stakeholders (employees) or local stakeholders. Conversely, we can observe and we find strong support for the role of the managerial dimension in adopting an SD certification, a personal decision based on the vision of the future and the search for higher wine quality and winery endowments. Regarding the literature-review section, this result is notably in line with the works of Jourjon et al. (2016) or Delmas and Toffel (2004).
More generally, this outcome allows us to add one piece of the puzzle concerning certification labeling in the wine industry: why many wineries do not disclose their SD certification. Following our results, the certification is driven by personal convictions and involvement of the manager (only significant driver). One of the main drivers studied in the literature (demand) is missing here. This result highlights that the adoption of sustainable practices precedes the certification decision. Managers don’t need to certify to sustain their practices in the vineyard or the cellar. They decide first according to their personal convictions. Therefore, it makes sense to see several certified wineries not disclosing their certification by a specific label. To display the signal on the label, they would probably need the perceive that the other drivers play a role. If it is not the case, this label would be a pure cost if there is no marketing gain expected, as mentioned in the literature (Barber et al., 2009; Delmas and Grant, 2010; Vecchio, 2013).
Conclusion
Based on a survey of 101 wineries in California and Bordeaux regions, this paper aims to determine the role of the manager convictions in SD certification adoption. The main interest of a survey is to embrace all the possible drivers of SD certifications through a large set of questions, rather than to focus only on one specific potential driver, as often done in the literature. However, the drawbacks of such a survey is the small size of the sample. A theoretical analysis, based on a literature review 83and a stakeholder approach, provides a conceptual framework for interpreting the logistical regressions estimating the probability to adopt an SD certification. The SD certification adoption would not come first from the stakeholders’ pressure in general, nor from the consumers’ demand in particular. The SD certification of the wineries would be driven by the managers’ convictions about the impact of SD on wine quality, the quality of the winery endowments (soil, water, etc.) and their personal involvement in SD. This outcome seems robust and consistent regarding the various econometric approaches used.
Therefore, the fact to adopt an SD certification and not to disclose the certification by a specific label appears as rational according to the absence of consumers’ or market-related motivations. Consequently, these results help to explain why winemakers do not always communicate about their SD certifications. Moreover, this “conviction” factor should also help to understand the rising trend concerning biodynamic and natural wines. Winemakers are committed to such an approach by conviction, not by any wish to please the market. The fact that there is no clear certification – especially for natural wines – does not matter.
In future work, it would be useful to enhance the size of the sample to (i) analyze the joined role of the different stakeholders, (ii) to test the role of the structure of the wine industry and (iii) to compare our results to other wine regions. It would also be interesting to analyze the attitude of the consumers regarding the winemakers’ convictions. Finding a way to create a club effect, or a community effect linked to specific values and convictions about SD might open new opportunities for selling wines. Social networks, rather than traditional labels, represent good candidates for such new marketing in the wine sector. This trend has already emerged and should be decisive in the future.
84References
Abraben L.A., Grogan K.A., Gao Z., 2017, “Organic price premium or penalty? A comparative market analysis of organic wines from Tuscany”, Food Policy, vol. 69, p. 154-165.
Alonso Ugaglia A., 2011, Une approche évolutionniste de la réduction des pesticides en viticulture, Doctoral dissertation, Univ. Bordeaux, France, 482 p.
Alonso Ugaglia A., Cardebat J.M., Jiao L., 2019, “The French wine industry”, in Alonso Ugaglia A., Cardebat J.M., Corsi A. (eds), The Palgrave Handbook of Wine Industry Economics, Palgrave Macmillan, Cham, p. 17-46.
Atkin T., Gilinsky A., Newton S.K. (2012), “Environmental strategy: Does it lead to competitive advantage in the US wine industry?”, International Journal of Wine Business Research, vol. 24, no 2, p. 115-133. https://doi.org/10.1108/17511061211238911 (accessed on 13/07/2021).
Barber N., Taylor C., Strick S., 2009, “Wine consumers’ environmental knowledge and attitudes: Influence on willingness to purchase”, International Journal of Wine Research, vol. 1, p. 59-72. https://doi.org/10.2147/IJWR.S4649 (accessed on 13/07/2021).
Bazoche P., Deola C., Soler L.-G., 2008, “An experimental study of wine consumers’ willingness to pay for environmental characteristics”, EAAE 2008, 12th Congress of the European Association of Agricultural Economists.
Blackman A., Rivera J., 2011, “Producer-level benefits of sustainability certification”, Conservation Biology: The Journal of the Society for Conservation Biology, vol. 25, no 6, p. 1176-1185. doi: 10.1111/j.1523-1739.2011.01774.x.
Broome J., Warner K., 2008, “Agro-environmental partnerships facilitate sustainable wine-grape production and assessment”, California Agriculture, vol. 62, no 4, p. 133-141. https://doi.org/10.3733/ca.v062n04p133 (accessed on 13/07/2021).
Castellini A., Mauracher C., Troiano S., 2017, “An overview of the biodynamic wine sector”, International Journal of Wine Research, vol. 9, no 1, p. 1-11.
CIVB, 2020, Dossier de presse, Conseil interprofessionnel des vins de Bordeaux, Bilan 2019 et stratégie 2020, 86 p. URL: https://www.bordeaux.com/media/wp-content/uploads/2020/03/DP2020_CIVB_g%C3%A9n%C3%A9ral_BD.pdf (accessed on 18/04/2021).
Chris K.L., Burritt R.L., 2013, “Critical environmental concerns in wine production: An integrative review”, Journal of Cleaner Production, no 53, p. 232-242. http://dx.doi.org/10.1016/j.wep.2013.11.002 (accessed on 13/07/2021).
85CSWA, 2020, Certified California sustainable winegrowing annual report 2020, 6 p. URL:https://www.sustainablewinegrowing.org/amass/library/30/docs/2-CSWA.Annual Report2020.pdf (accessed on 18/04/2021).
De Steur H., Temmerman H., Gellynck X., Canavari M., 2019, “Drivers, adoption, and evaluation of sustainability practices in Italian wine SMEs”, Business Strategy and the Environment, 2020, no 29, p. 744-762.
Dankers C., 2003, Environmental and social standards, certification and labeling for cash crops, FAO, Rome.
Dasgupta P., 2009, “The welfare economic theory of green national accounts”, Environmental and Resource Economics, vol. 42, no 1, p. 3-38.
Delmas M., 2010, “Perception of eco-labels: Organic and biodynamic wines”, Working Paper, Los Angeles: UCLA Institute of the Environment.
Delmas M., Doctori-Blass V., Shuster K., 2008, “Ceago vinegarden: How green is your wine? Environmental differentiation strategy through eco-labels”, Working Paper no 14, AAWE Working Paper, march 2008, 32 p.
Delmas M., Anvery Y., Goel S., Hareesh S., Hogan J., Menchaca A., Ramirez R., 2009, “Sustainable practices and certification in the California wine industry: Analyzing the motivations of winemakers and grape growers”, UCLA Environment Practicum in Environmental Science, Final Report.
Delmas M., Gergaud O., 2014, “Sustainable certification for future generation: The case of family business”, Family Business Review, vol. 27, no 3, p. 228-243. https://doi.org/10.1177/0894486514538651 (accessed on 13/07/2021).
Delmas M., Gergaud O., 2021, “Sustainable practices and product quality: Is there value in eco-label certification? The case of wine”, Ecological Economics, vol. 183, 106953. https://doi.org/10.1016/j.ecolecon.2021.106953 (accessed on 13/07/2021).
Delmas M., Grant L.E., 2010, “Eco-labeling strategies and price-premium: The wine industry puzzle”, Business & Society, vol. 53, no 1, p. 6-44. https://doi.org/10.1177/0007650310362254 (accessed on 13/07/2021).
Delmas M., Toffel M.W., 2004, “Stakeholders and environmental management practices: An institutional framework”, Business strategy and the environment, vol. 13, no 4, p. 209-222. https://doi.org/10.1002/bse.409 (accessed on 13/07/2021).
Dodds R., Graci S., Ko S., Walker L., 2013, “What drives environmental sustainability in the New Zealand wine industry?”, International Journal of Wine Business Research, vol. 25, no 3, p. 164-184. https://doi.org/10.1108/IJWBR-2012-0015 (accessed on 13/07/2021).
Feder M., Weißenberger B.E., 2021, “Towards a holistic view of CSR-related management control systems in German companies: Determinants and corporate performance effects”, Journal of Cleaner Production, vol. 294, 126084.
86Forbes S.L., Cohen D.A., Cullen R., Wratten S.D., Fountain J., 2009, “Consumer attitudes regarding environmentally sustainable wine: An exploratory study of the New Zealand marketplace”, Journal of Cleaner Production, vol. 17, no 13, p. 1195-1199. https://doi.org/10.1016/j.jclepro.2009.04.008 (accessed on 13/07/2021).
Gabzdylova B., Raffensperger J.F., Castka P., 2009, “Sustainability in the New Zealand wine industry: Drivers, stakeholders and practices”, Journal of Cleaner Production, vol. 17, no 11, p. 992-998. https://doi.org/10.1016/j.jclepro.2009.02.015 (accessed on 13/07/2021).
Gilinsky A. Jr, Newton S.K., Atkin T.S., Santini C., Cavicchi A., Casas A.R., Huertas R., 2015, “Perceived efficacy of sustainability strategies in the US, Italian, and Spanish wine industries: A comparative study”, International Journal of Wine Business Research, vol. 27, no 3, p. 164-181. https://doi.org/10.1108/IJWBR-10-2014-0047 (accessed on 13/07/2021).
Giraud-Heraud E., Hoffman R., 2010, “Corporate social responsibility as a strategy for safe and healthy food”, in Crifo P. and Ponssard J.P. (eds), Corporate social responsibility: from compliance to opportunity?, Éditions de l’École Polytechnique, France, 2010, p. 169-188.
Hobeika S., Ponssard J.P., Poret S., 2013, « Le rôle stratégique d’un label dans la formation d’un marché. Le cas de l’ISR en France », Cahier de recherche 2013-02, HAL Archives ouvertes <hal-00771304>.
Jourjon F., Sigwalt A., Symoneaux R., 2016, « Démarches et affichages environnementaux. Perception par les professionnels. Partie 2/3: Quelle stratégie collective et quels leviers pour la mise en marché des vins? », Revue des Œnologues, vol. 158, p. 55-57.
Jover A.J.V., Montes F.J.L., Fuentes M.D.F., 2004, “Measuring perceptions of quality in food products: The case of red wine”, Food Quality Preference, vol. 15, no 5, p. 453-469. https://doi.org/10.1016/j.foodqual.2003.08.002 (accessed on 13/07/2021).
Labaronne D., Gana-Oueslati E., 2011, « Analyse comparative Maroc-Tunisie du cadre institutionnel de la RSE dans les PME », Management Avenir, vol. 3, p. 103-121.
Lockshin L., Corsi A.M., 2012, “Consumer behavior for wine 2.0: A review since 2003 and future directions”, Wine Economics and Policy, vol. 1, no 1, p. 2-23. https://doi.org/10.1016/j.wep.2012.11.003 (accessed on 13/07/2021).
Marette S., 2014, “Economics benefits coming from the absence of labels proliferation”, Journal of Agricultural and Food Industrial Organization, vol. 12, p. 65-73. https://doi.org/10.1515/jafio-2013-0014 (accessed on 13/07/2021).
Muñoz R.M., Fernández M.V., Salinero Y., 2021, “Sustainability, Corporate Social Responsibility, and Performance in the Spanish Wine Sector”, Sustainability, vol. 13, no 1:7. https://doi.org/10.3390/su13010007 (accessed on 13/07/2021).
87Newey W.K., West K.D., 1987, “A Simple, Positive Semi-Definite, Heteroskedasticity and Autocorrelation Consistent Covariance Matrix”, Econometrica, vol. 55, no 3, p. 703-708.
Official Journal of the European union (OJEU), 2012, Regulation (EU) no 203/2012 of 8 March 2012 amending Regulation (EC) no 889/2008 laying down detailed rules for the implementation of Council Regulation (EC) No 834/2007, as regards detailed rules on organic wine. https://eurlex.europa.eu/LexUriServ/LexUriServ.do?uri=OJ:L:2012:071:0042:0047:EN:PDF (accessed on 13/07/2021).
Padel S., 2001, “Conversion to organic farming: A typical example of the diffusion of an innovation”, Sociologia Ruralis, vol. 41, no 1, p. 40-61. https://doi.org/10.1111/1467-9523.00169 (accessed on 13/07/2021).
Pérès S., Giraud-Héraud E., Masure A.S., Tempere S., 2020, “Rosé Wine Market: Anything but colour?”, Foods, 9. https//doi:10.3390/foods9121850 (accessed on 13/07/2021).
Pomarici E., Vecchio R., Mariana A., 2015. “Wineries’ perception of sustainability costs and benefits: An exploratory study in California”, Sustainability, vol. 7, no 12, p. 16164-14174. https://doi.org/10.3390/su71215806 (accessed on 13/07/2021).
Porter M.E., 1998, The competitive advantage: creating and sustaining superior performance, NY, USA: Free Press (First published 1985).
Pullman M.E., Maloni M.J., Dillard J., 2010, “Sustainability practices in food supply chains: How is wine different?”, Journal of Wine Research, vol. 21, no 1, p. 35-56. https://doi.org/10.1080/09571264.2010.495853 (accessed on 13/07/2021).
Raineau Y., 2018, Défis environnementaux de la viticulture: une analyse comportementale des blocages et des leviers d’action, Doctoral dissertation, Univ. Bordeaux, France.
Raineau Y., Pérès S., Pons A., Tempère S., Giraud-Héraud E., 2018, « Vins bio, vins sans sulfites ajoutés, vins nature: Quelles demandes réelles des consommateurs? », Droit et Patrimoine, p. 37-41.
Sangue Fotso R., 2018, « Perception de la RSE par les dirigeants de PME camerounaises », Revue internationale PME, vol. 31, no 1, p. 129-155.
Santini C., Cavicchi A., Casini L., 2013. “Sustainability in the wine industry: Key questions and research trends”, Agricultural and Food Economics, vol. 1, no 1, p. 1-9. https://doi.org/10.1186/2193-7532-1-9 (accessed on 13/07/2021).
Sogari G., Mora C., Menozzi D., 2016, “Factors driving sustainable choice: The case of wine”, British Food Journal, vol. 118, no 3, p. 632-646. https://doi.org/10.1108/BFJ-04-2015-0131 (accessed on 13/07/2021).
Steenkamp J.B.E.M., 1990, “A conceptual model of the quality perception process”, Journal of Business Research, vol. 21, no 4, p. 309-333. https://doi.org/10.1016/0148-2963(90)90019-A (accessed on 13/07/2021).
88USDA/ERS, 2016, Farm income and wealth statistics database, Retrieved February 2016, from: http://www.ers.usda.gov/data-products/farm-income-and-wealth-statistics/data-files-us-and-state-level-farm-income-and-wealth-statistics.aspx (accessed on 13/07/2021).
UNU-IHDP/UNEP, 2014, Inclusive Wealth Report 2014. Measuring progress toward sustainability (Summary for Decision-Makers, Delhi: UNU-IHDP).
Vecchio R., 2013, “Determinants of willingness-to-pay for sustainable wine: Evidence from experimental auctions”, Wine Economics and Policy, vol. 2, no 2, p. 85-92. https://doi.org/10.1016/j.wep.2013.11.002 (accessed on 13/07/2021).
Waldrop M., McCluskey J.J., Mittelhammer R.C., 2017, “Products with multiple certifications: Insights from the U.S. wine market”, European Review of Agricultural Economics, vol. 44, no 4, p. 658-682. https://doi.org/10.1093/erae/jbx010 (accessed on 13/07/2021).
Warner K.D., 2007, “The quality of sustainability: Agroecological partnerships and the geographic branding of California wine grapes”, Journal of Rural Studies, vol. 23, no 2, p. 142-155. https://doi.org/10.1016/j.jrurstud.2006.09.009 (accessed on 13/07/2021).
Wine Institute, 2014, World wine production by country, Retrieved February 2016, from: http://www.wineinstitute.org/files/World_Wine_Production_by_Country_2014_cTradeDataAndAnalysis.pdf. Accessed February 18, 2016.
World Bank, 2011, World development report 2011 – Conflict, security and development (Washington: The International Bank for Reconstruction and Development / The World Bank).
Zucca G., Smith D.E., Mitry D.J., 2009, “Sustainable viticulture and winery practices in California: What is it, and do customers care?”, International Journal of Wine Research, vol. 2, no 1, p. 189-194. https://doi.org/10.2147/IJWR.S5788 (accessed on 13/07/2021).
89Appendix 1
Definition of variables and main statistics excluding NAs,
“does not wish to answer” and “non applicable”
|
Code |
Variable |
Significant Statistics |
|
|
Certi |
SD Certification of the estate |
Estates have a SD certification |
45% |
|
Winezone |
Estate country |
France (Bordeaux) |
84% |
|
Region |
Estate wine region |
Blaye Sauternes Saint-Emilion Graves Bordeaux (others) Médoc San Diego California (others) |
21% 16% 14% 12% 11% 10% 9% 7% |
|
Size |
Estate surface |
Very small Small Average Big Very big |
11% 21% 27% 29% 12% |
|
Number |
Range of different bottles |
More than 5 |
39% |
|
Sales |
Income from sales |
Less than 500k€ (or eqUSD) More than 500k€ No answer |
52% 31% 17% |
|
Price |
Price range of the main bottlea |
Normal Premium Super premium |
66% 25% 9% |
|
Role |
Position of the respondent |
Employees Strategic manager Owner |
20% 33% 47% |
| 90
Age |
Age of the respondent |
18-35 36-55 +55 |
15% 57% 28% |
|
Sdpilar |
Importance of each SD pillar for SD according to the respondent |
Same importance of 3 pillars Economic pillar Env or Social |
69% 16% 15% |
|
Pricesd |
Commitment to SD of the estate |
yes |
82% |
Source: Authors.
aWe build a scale based on three price ranges adapted to the two countries (Normal: 0-15€ in France and 0-30USD in US; Premium: 15-30€ in France and 30-50USD in US; Super premium: more than 30€ in France and more than 50USD in US).
91Appendix 2
Using exploratory data analysis to treat serial correlation
We use the properties of PCA and related methods to design composite indexes (synthetic variables) based on the reordering of the underlying variance in the dataset of our questionnaire. We first run a Multiple Factor Analysis (MFA) with our variables grouped in property (size, number, sales, empclass, prices), manager (role, age, sdpilar, princsd), outcome-based (nitrate, water, energy, ghg) variables and opinion-based (sdemploy, sdmarket, sdsoils, sdopinion, sdwinqual, sdlead, sdsur) variables for SD perception. This global analysis tells us there are important differences across wine sub-regions, which justify treating regions as a separate variable. But there are no cross-group correlations that would justify merging some of our groups. Figure 3 shows an indicative grouping of our respondents based on all our variables.
Based on this first analysis, we run two Multiple Correspondence Analyses (MCA) on our qualitative (descriptive) variables divided between property and managerial characteristics and one Principal Component Analysis (PCA) on the Likert scale with it used to assess the importance of SD drivers. From these analyses we obtain 3 composite indexes made of 2, 3 and 2 dimensions respectively. As a result, we can now characterise all our individuals in our sample not by our original variables, but by their coordinates along the 7 dimensions of our composite indexes. These are the dimensions we use for the inferential statistics models (synthetic variables).
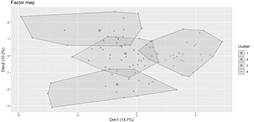
Fig. 3 – Clustering of respondents in the first Stage, global MFA. Source: Authors.
92Appendix 3
Simple-level logistical regressions
|
Dependent variable: |
||
|
Initial variables (1) (from the questionnaire) |
Synthetic variables (2) (from the MFA) |
|
|
Respondent has a strategic Role |
1.38a p = 0.05 |
|
|
Respondent is the Owner |
0.62 p = 0.38 |
|
|
Company size]10; 50] employees |
2.22 p = 0.10 |
|
|
Environmental view of SD |
-0.11 p = 0.92 |
|
|
Systemic view of SD (env, eco, social) |
1.16 p = 0.18 |
|
|
Individual opinion of the respondent about SD |
0.44b p = 0.03 |
|
|
SD-engaged profile of the manager |
0.69a p = 0.06 |
|
|
Outcome-based SD (long-term quality of the wine) |
0.39c p = 0.01 |
|
|
California (Non San Diego) |
1.17 p = 0.53 |
1.84 p = 0.18 |
|
Blaye |
2.10a p = 0.05 |
2.01 p = 0.10 |
|
Sauternais |
2.22b p = 0.04 |
2.14a p = 0.08 |
|
Graves |
2.23a p = 0.05 |
1.51 p = 0.24 |
| 93
Broad St-Emilion |
3.69c p = 0.00 |
3.65b p = 0.01 |
|
Broad Médoc |
-1.00 p = 0.54 |
-0.05 p = 0.97 |
|
Bordeaux Supérieur |
3.11b p = 0.01 |
2.66b p = 0.03 |
|
Constant |
-7.57c p = 0.00 |
-2.19a p = 0.05 |
|
Observations Log Likelihood Akaike Inf. Crit. |
101 -46.87 121.74 |
101 -51.52 123.05 |
Source: Authors.
Note: ap<0.1; bp<0.05; cp<0.01.
94Appendix 4
Multilevel logistical regressions
|
Dependent variable: SD Certification |
||
|
Variables Regression |
Dimensions Regression |
|
|
(1) |
(2) |
|
|
Company size]10; 50] employees |
1.77b p = 0.04 |
|
|
Respondent has a strategic Role |
1.09 p = 0.14 |
|
|
Respondent is the Owner |
0.45 p = 0.51 |
|
|
Environmental view of SD |
0.00 p = 0.99 |
|
|
Systemic view of SD (env, eco, social) |
1.21a p = 0.09 |
|
|
Individual opinion of the respondent about SD |
0.46b p = 0.01 |
|
|
SD-engaged profile of the manager |
0.67a p = 0.09 |
|
|
Outcome-based SD (long-term quality of the wine) |
0.41c p = 0.00 |
|
|
Constant |
-5.67c p = 0.00 |
-0.36 p = 0.31 |
|
Observations Log Likelihood Akaike Inf. Crit. Bayesian Inf. Crit. |
-55.83 127.67 148.59 |
101 -59.18 126.36 136.82 |
Source: Authors.
Note: ap<0.1; bp<0.05; cp<0.01
1 Within the US, California is the largest producer of wine and makes a significant contribution, not only to California’s economy, but to the US economy as well (USDA/ERS, 2016; Wine Institute, 2014).
2 France has been historically the leader of wine production around the world and is still one of the biggest producers in volume, along with Spain and Italy, and remains the main producer in value. Within the French wine regions, the Bordeaux wine area is the main one under the appellation system and represented 39% of the volume and 49% of the value of French exports of PDO (Protected Designation of Origin) wines (FranceAgriMer).
3 Out of the 5660 wine firms of the Bordeaux wine region.
4 The psycho-sociological characteristics being differentiated from the convictions, the values or the contradictory objectives of the foundation of the reference to fears or fears by the social environment.
5 They also show that the cooperative has an important role to play in the decision to certify if the farmer is a cooperative member.
6 The term “manager” refers all along the paper to the person in charge of the decision to certify.