Service firm innovation Disaggregated sectoral classification analysis for Mexico
- Publication type: Journal article
- Journal: European Review of Service Economics and Management Revue européenne d’économie et management des services
2020 – 2, n° 10. varia - Author: Zagaceta-García (Juan Carlos)
- Pages: 49 to 71
- Journal: European Review of Service Economics and Management
SERVICE FIRM INNOVATION
Disaggregated sectoral classification analysis for Mexico
Juan Carlos Zagaceta-García1
University of Guadalajara
INTRODUCTION
All of the world’s most advanced economies are dominated by the service sector. In many, it accounts for more than 70% of their GDP. The service sector is also important for developing and emergent countries (OECD, 2011); for example, it accounts for 52.2% of GDP in China, and 60.1% of GDP in Mexico (World Bank, 2018). Service growth is projected to continue in both groups of countries.
Innovation surveys show that firms invest in innovation in order to gain market share, reduce costs, and increase profits (OECD, 2000). The traditional way of grouping service firms is by industry or by sector (hospitality, banking, telecommunications, transportation, maintenance, etc.). This classification is standardised, to some extent, across countries, so there is data that can be compared across countries, sectors and firms. However, in most developing countries, there is neither any such consensus nor sufficient information available to measure service innovation and its effects.
This paper aims to picture innovation activities in Mexican services firms at a disaggregated level (in this case, at branch level). Most innovation studies in services are made at sector level, regardless of the type 50of classification used. Furthermore, to take into account firms’ technological bases in their innovative efforts, we complement this sectoral study by using Soete and Miozzo’s technological trajectory framework in this study (Soete and Miozzo, 1990). We do this in order to compare national industry classifications and technological change approaches. Another motive for this dual perspective is that we consider innovation a cumulative and specific process, rather than a disembodied outcome (Gallouj, 2002). We therefore pose the following questions:
–Which sectors and branches of services in Mexico are most innovative, using the North American Industry Classification System (NAICS)2?
–Which sectors and branches of services in Mexico are most innovative, using Soete and Miozzo’s technological trajectory approach?
Our analysis is based on data from the 2004 and 2009 Economic Censuses, which include a module of surveys on Innovation and Research using dichotomous (“yes” or “no”) questions. It is important to note that the two surveys are different: the 2009 survey has more questions than the 2004 survey, and many of these concern the use of Information and Communication Technologies (ICTs). Like most innovation studies, the surveys concentrate mainly on technological innovations. This is because they were first designed for manufacturing firms, and were just applied to service firms using the so-called “subordination approach” to service innovation (Djellal and Gallouj, 1999). However, we think this database offers certain benefits. First, since the data comes from censuses, it offers unparalleled coverage of most service firms in Mexico. Second, unlike traditional questionnaires, the survey’s structure covers all types of innovation, including product and service innovations, process innovations, organisational innovations and external relationship innovations.
The study uses the methodology proposed in Ayyagari et al. (2011), although it has been adapted to the data available in Mexico. Over the period 2002-2004, these authors addressed innovation in emerging markets using a sample of 19,000 SMEs across 47 developing countries. It was focused on company level, without distinguishing between sectors. 51In addition to individual indicators of innovation activities, they analysed two aggregate indices: “Core Innovation” and “Aggregate Innovation”.
This article is divided into four sections. The first reviews the relevant service innovation literature, and the second describes the database and methodology. The third section analyses innovation sectors and branches, using both the The North American Industry Classification System (NAICS) and the Soete and Miozzo technological trajectories approach. In the final section, we summarize and discuss the results.
1. SERVICE INNOVATION AND TECHNOLOGICAL TRAJECTORIES TAXONOMY
1.1 SERVICE INNOVATION
Economists see innovation and technological change as crucial elements of economic growth and development (Schumpeter, 1942; Solow, 1957; Griliches, 1986; Fageberg, 1988; Freeman, 1994; Silverberg and Soete, 1994; Freeman and Soete, 1997; Griliches, 1998; Baumol, 2002; Aghion and Durlauf, 2005; Ayyagari et al., 2011). Up until now, services have largely been considered technologically backward, with innovation playing no role in the aggregate performance of these sectors (Cainelli et al., 2006). However, Gallouj (2002) contends that in services, non-technological innovations and innovation trajectories (such as cognitive trajectories) are as important as technological trajectories.
For Gallouj (2002, see also Gallouj and Weinstein, 1997), there are three approaches to literature on innovation in services:
1. The technologist or subordination (or assimilation) approach equates or reduces innovation in services to the introduction of technical systems into services firms and organisations
2. The service-oriented (or demarcation) approach seeks to identify any particularities in the nature and organisation of innovation in services
3. The integrative or synthesis approach favours a similar analytical approach to innovation in goods and services
52Compared with the primary and manufacturing sectors, services exhibit certain peculiarities: the product is a process; it is not only intangible and impossible to store, but also “nebulous” and extremely heterogeneous. Furthermore, it is interactive, which means that service customers and providers collaborate in the design, production and delivery of the service, and production and consumption are simultaneous (Gallouj, 2002; Miles, 2005; Castellacci, 2008).
The use of advanced ICTs has enabled the creation of new service delivery mechanisms, reducing the time required to develop and introduce new services. The service sector is a heavy user of these technologies, and the economic impact of such technologies is more visible in this sector (Cainelli et al., 2006)3.
Although technology is important, other forms of innovation (non-technological product/service and process innovations, organisational innovation, methodological innovations, etc.) are equally important. And if the service company does have an innovation department (which is not the case for most), its actors are seldom alone in the innovation process. They are almost always supplemented by (and in competition with) formalised though non-permanent innovation structures (project groups made up of people from different departments) - particularly in knowledge-intensive activities featuring a high level of informal encounters among its stakeholders (Sundbo, 1998; Fuglsang, 2008; Djellal and Gallouj, 1999, 2001; Gallouj and Djellal 2010).
In conclusion, it can be said that services do innovate significantly, though differently from manufacturing sectors (Miles et al., 1994; Sundbo, 1998; Djellal and Gallouj (1998) and Gallouj, 2002). Taking account of the distinctive features of services requires a multidisciplinary approach that involves organisational behaviour, social networks, marketing, strategy and communication (Tether and Howells, 2007).
1.2 TAXONOMIES OF TECHNOLOGICAL TRAJECTORIES
Many innovation studies have focused on the technologist approach. Surveys originally designed for use by manufacturing firms were thus also used by service firms (Djellal and Gallouj, 1999), despite the fact 53that they were ill-equipped to accommodate the realities of innovations in services (Gallouj, 2002).
In order to identify the main sources and characteristics of technological change in economic sectors, as well as its economic impacts, various taxonomies have been proposed: Freeman, 1982; Pavitt, 1984; Freeman and Soete, 1987, 1997; Mills, 1986; Lakshmanan, 1987; Pavitt et al., 1989; Soete and Miozzo, 1990; Miozzo and Soete, 2001; Gallouj, 1999).
Pavitt’s (1984) seminal work uses a range of criteria and characteristics, including sources of technology, types of user and user needs, innovation appropriation regimes, size of company, degree of technological diversification and others. He divided the economy into four categories, each representing a sectoral model of technical change: supplier dominated firms; scale-intensive firms; specialised suppliers, and science-based firms. Services are included only in the case of “supplier dominated firms” – although non-market services were not taken into account (Gallouj, 2002).
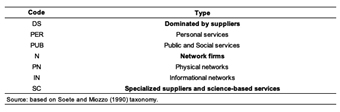
Soete and Miozzo (1990) rejected the hypothesis (supported by some authors) that technological behaviour in the service sector was homogeneous. Their taxonomy uses Pavitt’s criteria, yet does not consider services to belong to any single category. Soete and Miozzo’s taxonomy includes three types of firms and industries:
1. Firms “dominated by suppliers” of equipment and technical systems. These firms’ innovative activities consist of adopting the technologies of industrial suppliers, and can be subdivided into two groups:
1.1 Personal services: small firms whose customers are sensitive to performance and whose modes of innovation appropriation are non-technological. These modes include professional know-how, aesthetic design, branding and advertising (e.g. repair services, cleaning, hotel and catering, retailing, laundry services).
1.2 Public and social services: large firms and organisations whose customers are conscious of quality, but not in a stringent manner. Moreover, their innovations constitute public goods (e.g. education, health and public administration).
2. “Network firms”: these follow a trajectory characterised by cost reduction and implementation of a networking strategy. They tend to be sizeable firms, and their main modes of innovation appropriation are through 54standards and norms. Their customers are extremely price sensitive. These firms may turn to outside suppliers for their technologies, but always do so from a position of strength. They can be subdivided into two groups by principal means of service delivery:
2.1. Physical networks: firms whose services are based on tangible resources (e.g. transport, wholesale trade).
2.2. Informational networks: Codified information is the means of service delivery (e. g. finance, insurance, and communications).
3. “Specialised suppliers and science-based services”: These are characterised by small firms whose technological trajectory is based on system design. Their clients are more concerned with technology performance than cost, while the innovation appropriation regime is dominated by R&D know-how, copyright and product differentiation. The source of technology can be in-house, customer or supplier (e.g. service providers having particular relationships to R&D, information technologies and telecommunications).
However, in both of these taxonomies (Pavitt, and Soete and Miozzo), the technological trajectory alone is considered. Yet in services, other (non-technological) trajectories play an important role. These other trajectories may be cognitive (based on the improvement of competences), methodological, data processing, social or organisational (Gallouj, 2002).
2. DATABASE AND ANALYSIS METHODOLOGY
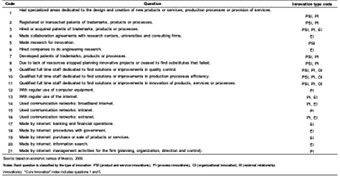
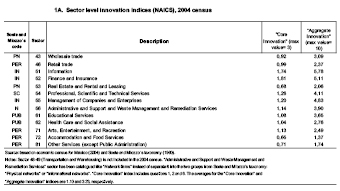
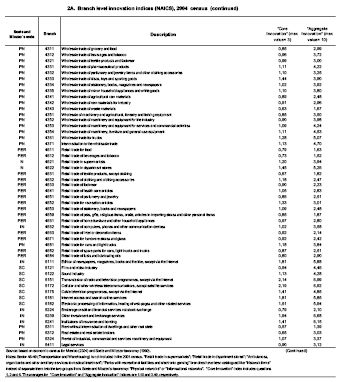
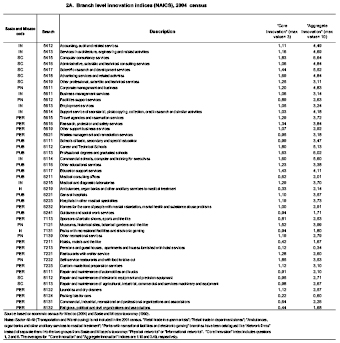
The study is based on 2004 Census4 data from 13 sectors and 96 branches and 2009 Census5 data from 12 sectors and 64 branches. The analysis counts the number of affirmative responses linked to innovation 55activities made by firms (see Table 1 for the 2004 Census, which includes ten questions, and Table 2 for the 2009 Census, which includes 21 questions). Those responses are codified as dichotomous variables (Yes = 1, No = 0). Next, they are grouped at sector and branch levels. The percentages thus obtained are used to construct the indices for the study. It should be noted that these censuses do not include firm level data6, but they do provide branch level responses. The indices are therefore constructed from the percentages for each sector and branch.
The questions in these tables are classified by innovation type: Product and Service Innovations (PSI), Process Innovations (PI), Organisational Innovations (OI) and External Relationship Innovations (EI). A single activity (question) can encompass several innovation types.
In addition to census questions, we created two aggregate indices of innovation: “Core Innovation” and “Aggregate Innovation” (constructed according to the methodology proposed by Ayyagari, et al., 2011). The “Aggregate Innovation” index measures the total number of responses linked to innovation activities, whereas the “Core Innovation” index counts only those responses linked to activities considered basic or essential to the development of product or service innovations. The “Core Innovation” index includes three questions (1, 2 and 6) from the 2004 Census and two questions (1 and 5) from the 2009 Census. The “Core Innovation” index could express a “technologist view” in which services are seen as unsuited to R&D and innovation (see Gallouj and Djellal (2010) for a critique of this position). For this reason, we consider results for this indicator to be technologically biased. Nevertheless, we use it to contrast results with the “integrative view” of the “Aggregate Innovation” index.
The values for the aggregate indices are constructed by adding up the percentages of affirmative responses for each classification. We find these indices to be useful for indicating which sectors or branches are most innovative. In all cases, high values for these indices reflect high levels of innovation. The maximum values for “Aggregate Innovation” indices in the 2004 and 2009 Censuses are ten and twenty-one, respectively; the maximum values for “Core Innovation” indices in the 2004 and 2009 Censuses are three 56and two, respectively. The minimum value for all cases is zero. For all the innovation activities indices, we have created tables for both classification level and census (a detailed description is found in Zagaceta-García, 2016). We also include Soete and Miozzo’s classification codes (See Appendix, Tables 1A-4A). However, it is important to note that due to methodological differences, it is difficult to make comparisons between censuses (due to the differing number of questions for each census, confidentiality problems, and the incompatibility of different versions of NAICS).
Tab. 1 – Questions on innovation activity in Mexican firms, 2004 Census.

Tab. 2 – Questions of innovation activity in Mexican firms, 2009 census.
Lastly, we analyse the responses for Mexican firms’ innovation activities at the sector and branch levels, using Soete and Miozzo’s taxonomy (see classification codes in Table 3). For the final part of the study, we use only the aggregate indices (“Aggregate Innovation” and “Core Innovation”). First, for each census, we obtain the average percentage of those indices at sector and branch levels. Second, we use Soete and Miozzo’s categories to classify sectors and branches. Third, for each category we choose the sectors and branches having value greater than or equal to the average aggregate indices. Finally, we calculate the category’s percentage of innovation (in all cases higher percentages correspond to higher degrees of innovation).
It is important to point out that in the case of “Network firms”, we find it difficult to distinguish physical networks from informational networks. This sector and these branches have therefore been catalogued as “Network firms”7.
Tab. 3 – Classification codes based on Soete and Miozzo’s taxonomy.
3. RESULTS
The results for the sector level analysis (2004 Census), show that Sector 51 (Information) has the greatest number of innovation activities, with an “Aggregate Innovation” index of 5.78 while Sector 72 (Accommodation and food services) has the lowest, at 1.37. The “Core Innovation” index (representing the use of “core” innovation activities) shows that Sector 52 (Finance and insurance) is the highest performer with an index of 1.81. The lowest innovator is again Sector 72, at 0.65. Meanwhile, the activities performed most across all sectors fall under “Adapted their goods or services to changes in the preferences of their customers” (PSI innovation type) and “Trained staff in the use of new technologies and work processes” (PI and OI types). The least performed activity is “Registered products or other works of intellectual creation to intellectual property institutes” (PSI and PI types). This tells us that different forms of innovation are present in services, though some service characteristics render a contrast with manufacturing difficult.
For the sector level analysis (2009 Census), Sector 52 (Finance and insurance) is most innovative, with an “Aggregate Innovation” index of 11.68, while the least innovative sector (as in the previous census) is Sector 72, at 3.83. Sector 52 (Finance and insurance) again has the highest “Core Innovation” index, and the lowest is once again Sector 72. In this census, the most common activity performed is “Made by Internet: information search” (EI type). The least performed are “Hired or acquired patents of trademarks, products or processes” (PSI, PI and EI types), “Hired firms to do engineering research” (EI type) and “Developed patents of trademarks, products or processes” (PSI and PI types).
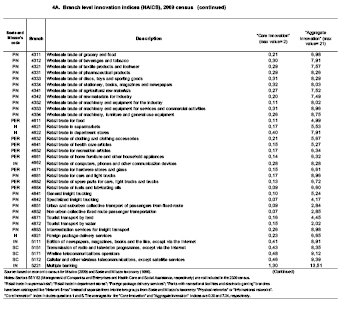
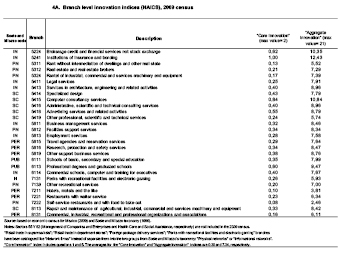
Branch level analysis (2004 Census), shows that Branch 5151 (Transmission of radio and television programmes, except via the internet) has the highest “Aggregate Innovation” index, with Branch 5172 (Cellular and other wireless telecommunications, except satellite services) coming in second place. Branch 7213 (Pensions and guest houses, apartments and houses furnished with hotel services) has the lowest “Aggregate Innovation” index. Branch 5172 (Cellular and other wireless telecommunications, except satellite services) has the highest 59“Core Innovation” index, with Branch 5151 (Transmission of radio and television programmes, except via the internet) in second place. These two branches switch places on the “Aggregate Innovation” index, and this result is consistent with the sector analysis, with Sector 51 (Information) rated the most innovative.
It is interesting to note that Branch 7222 (Self-service restaurants and with food to take-out) came in fourth place, with Branch 5415 (Computer consultancy services) coming in fifth. Once more, Branch 7213 has the lowest index. Interestingly, Branch 6219 (Ambulances, organ banks and other ancillary services to medical treatment) ranks very low. The analyses from the 2004 Census for branches thus show behaviour quite similar to that revealed in the innovation activity analysis at the sector level, in the 2004 and 2009 censuses.
Lastly, branch level analysis (2009 Census) shows that Branch 5221 (Multiple banking) scored the highest “Aggregate Innovation” index, Branch 5241 (Institutions of insurance and bonding) in second place. And Branch 4872 (Tourist transport by water) scored lowest. Branch 5221 again scored highest on the “Core Innovation” index and Branch 5241 came in second place on the “Aggregate Innovation” index. Branch 4852 (Non-urban collective fixed route passenger transportation) had the lowest index. The activity most performed for almost all branches is question number 20 (“Made by internet: information search”, EI type).
For the second part of the study, we drew up Table 4 (2004 Census) and Table 5 (2009 Census) to analyse the degree of innovation at both sector and branch levels, using Soete and Miozzo’s taxonomy.
Table 4 (2004 Census) shows the degree of innovativeness using Soete and Miozzo’s taxonomy, subdivided into sector level and branch level. In our analysis of the “Aggregate Innovation” index at sector level, we found (as do most innovation studies) that the most innovative firms belong to the “Specialised suppliers and science-based services” trajectory, with 100% of these sectors having a value that is greater or equal to the average. The second most innovative sector is “Network firms” with 66.7%. The least innovative sector is “Supplier-Dominated” firms with 16.7%. The “Personal services” category innovates more in core activities than “Public and Social services” does (25% vs. 0%, respectively).
At branch level, the various categories innovate as they do at sector level, although the percentages show less dispersion, no branch has scores 60at 100% or 0%. Furthermore, we can see that all “Network firms” and “Specialised suppliers and science-based services” groups have more types of innovation (in both “Aggregate Innovation” and “Core Innovation” indices) than “Dominated by suppliers” firms.
Tab. 4 – Innovation in Mexican services sectors and branches
(Soete and Miozzo’s taxonomy), 2004 Census.
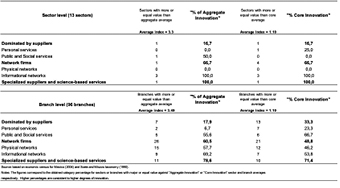
Table 5 (2009 Census) also uses Soete and Miozzo’s taxonomy to show the degree of innovativeness. In the “Aggregate Innovation” index at sector level, the ranking among categories is the same as it was in 2004: “Specialised suppliers and science-based services” are the most innovative (100%), followed by “Network firms” (66.7%) and “Supplier Dominated” firms (20%). In addition, “Personal services” still scores 0%, as it did in 2004, whereas “Physical networks” go from 0% to 33.3%. “Public and Social services” increase from 50% to 100%. With the exception of “Personal services”, all categories increased their aggregate score. In terms of the “Core Innovation” index, “Network firms” seem less innovative than they were in 2004 (50% vs. 66.7%).
At branch level, ranking in terms of innovativeness is maintained. As with 2004 Census, there is less dispersion at the branch level.
61Tab. 5 – Innovation in Mexican services sectors and branches
(Soete and Miozzo’s taxonomy), 2009 census.

CONCLUSION
In this paper, we have extended innovation studies to the service sector in developing countries. As the share of services in these countries’ GDP approaches that of developed countries, the service innovation topic is gaining in prominence. We used data from the 2004 and 2009 Economic Censuses of Mexico to identify which sectors and branches are most innovative in this country. We compared innovation in Mexican firms using both the North American Industry Classification System (NAICS) and Soete and Miozzo’s technological trajectories mapping.
The results of the first part of the study (using NAICS) indicate that all service sectors innovate. Service sectors traditionally seen as “the most innovative” (Information, Finance and Insurance, Professional, Scientific and Technical Services) are still ahead, undertaking the bulk of innovation-related activities, according to the two surveyed censuses. Breaking down sectors into branches allows a closer view of how innovation activities are distributed, with some branches appearing more 62innovative than the sectors they belong to. Branch level analysis is thus more accurate than sector level analysis.
By analysing how Mexican firms innovate, we found that firms tend to underexploit certain actions, such as “Registered products or other works of intellectual creation to intellectual property institutes”. This finding is in agreement with the conventional innovation surveys conducted to capture technological innovations, rather than the intrinsic characteristics of services. For the 2009 census, another underused category is “Activities with the involvement of other external agents or external relationship innovations”. This can be attributed to firms’ lack of confidence to explore the potential of the Open Innovation approach.
It should be observed that in developing countries like Mexico, “service firms collaborate with customers and suppliers more than through in-house R&D” according to Tether’s (2005) study on European countries.
Moreover, Mexican firms in all sectors and branches state that they include an innovation department. However, due to the specificities of services, we infer that many of these departments are in fact flexible project groups or “innovation structures” – as Djellal and Gallouj (1999) called them – rather than permanent physical areas.
Though the use of computer equipment and the internet is considered essential to services innovation specifically, the responses to questions 7 to 10 (2004 Census) and 12 to 21 (2009 Census) show that this kind of equipment is not broadly used in all sectors and branches. Nevertheless, in the 2009 Census, we can see extensive use of ICTs by most firms, although different firms may use them differently.
Lastly, using Soete and Miozzo’s mapping, we were able to confirm that the most innovative sectors and branches are “Specialised suppliers and science-based services” followed by “Network firms”, while the least innovative are those labelled as “Supplier Dominated”. In any case, contrary to the assertions of the technologist/assimilation approach, we found the service sector to be heterogeneous in terms of its innovative activities (Gallouj, 2002). We therefore advocate for analyses that are both finer, and more disaggregated, to portray service firms’ innovations more accurately.
63REFERENCES
Aghion P. and Durlauf S. (2005), Handbook of Economic Growth, Amsterdam, North Holland Elsevier Publishers.
Ayyagari M., Demirgüç-Kunt A., and Maksimovic V. (2011), “Firm Innovation in Emerging Markets: the Role of Finance, Governance, and Competition”, Journal of Financial and Quantitative Analysis, vol. 46, no 6, p. 1545-1580.
Baumol W. (2002), The Free-market Innovation Machine: Analysing the Growth Miracle of Capitalism, Princeton, NJ, Princeton University Press.
Cainelli G., Evangelista R. and Savona M. (2006), “Innovation and Economic Performance in Services: A Firm Level Analysis”, Cambridge Journal of Economics, vol. 30, no 3, p. 435-458.
Castellacci F. (2008), “Technological Paradigms, Regimes and Trajectories: Manufacturing and Service Industries in a New Taxonomy of Sectoral Patterns of Innovation”, Research Policy, vol. 37, no 6, p. 978-994.
Chesbrough H. (2006), Open Innovation: A New Paradigm for Understanding Industrial Innovation, Oxford, Chesbrough.
Djellal F. and Gallouj F. (1998), Innovation in service industries in France: results of a postal survey. SI4S project, European Commission, DG XII, TSER program, July.
Djellal F. and Gallouj F. (1999), “Services and the Search for Relevant Innovation Indicators: A Review of National and International Surveys”, Science and Public Policy, vol. 26, no 4, p. 218-232.
Djellal F. and Gallouj F. (2001), “Patterns of innovation organisation in service firms: postal survey results and theoretical models”, Science and Public Policy, vol. 28, no 1, p. 57-67.
Fageberg J. (1988), “Why growth rates differ?”, in Dosi G., Freeman C., Nelson R., Silverberg G and Soete L (eds.). Technological Change and Economic Theory, London, UK, Pinter, p. 432-457.
Freeman C. (1982), The Economics of Industrial Innovation, London, UK, Pinter.
Freeman C. (1994), “Critical Survey: The Economics of Technical Change”, Cambridge Journal of Economics, vol. 18, no 5, p. 463-512.
Freeman C. and Soete L. (eds.) (1987), Technical Change and Full Employment, Oxford, Basil Blackwell.
Freeman C. and Soete L. (1997), The Economics of Industrial Innovation, London, UK, Pinter.
64Fuglsang L. (ed.) (2008), Innovation and the Creative Process: Towards Innovation with Care, Cheltenham, UK and Northampton, MA, USA, Edward Elgar.
Gallouj F. (1999), “Les trajectoires de l’innovation dans les services : vers un enrichissement des taxonomies évolutionnistes”, Economies et Sociétés, Série EGS, n o1, 5, p. 143-169.
Gallouj F. (2002), Innovation in the Service Economy, Cheltenham, UK and Northampton, MA, USA, Edward Elgar.
Gallouj F. and Djellal F. (2010), The handbook of innovation and services: a multi-disciplinary perspective, in Gallouj F. and Djellal F. (eds.), Cheltenham, UK and Northampton, MA, USA, Edward Elgar.
Gallouj F., Weinstein O. (1997), “Innovation in Services”, Research Policy, vol. 26, n o4-5, p. 537-556.
Griliches Z. (1986), “Productivity, R&D and Basic Research at the Firm Level in the 1970s”, American Economic Review, vol. 76, no 19, p. 141-154.
Griliches Z. (1998), R&D and Productivity: The Econometric Evidence, Chicago, University of Chicago Press.
Herzog P. (2008), Open and Closed Innovation: Different Cultures for Different Strategies, Germany, Gabler Verlag.
Lakshmanan T. (1987), “Technological and institutional innovation in the service sector”, conference “Research and Development, Industrial Change and Economic Policy”, Karlstad, Sweden, June.
Miles I., Kastrinos N., Flanagan K., Bilderbek P., den Hertog P., Huntink W. and Bouman M. (1994), Knowledge-intensive business services: their role as users, carriers and sources of innovation. Manchester, PREST.
Miles I. (1995), Services innovation: Statistical and conceptual issues, report to OECD NESTY Working Group on innovation surveys. Manchester, PREST.
Miles I. (2005), “Innovation in services”, in The Oxford Handbook of Innovation, Oxford, Oxford University Press.
Mills P. (1986), Managing Service Industries: Organizational Practices in a Postindustrial Economy, Cambridge, MA, Ballinger Publishing Company.
Miozzo M. and Soete L. (2001), “Internationalisation of Services: A Technological Perspective”. Technological Forecasting and Social Change, vol. 67, no 2-3, p. 159-185.
National Institute of Statistics and Geography (INEGI) (2004), 2004 Economic Censuses methodology, México, INEGI.
National Institute of Statistics and Geography (INEGI) (2009), 2009 Economic Censuses methodology, México, INEGI.
National Institute of Statistics and Geography (INEGI) (2002), North American Industry Classification System (NAICS), México, INEGI.
National Institute of Statistics and Geography (INEGI) (2007), North American Industry Classification System (NAICS), México, INEGI.
65OECD (2000), Innovation and Economic Performance. Science, Technology and Industry Outlook 2000, Paris, OECD.
OECD (2011), “Science, Technology and Industry Scoreboard 2011”, available at: http://dx.doi.org/10.1787/sti_scoreboard-2011-en (retrieved on June 20, 2019).
Pavitt K. (1984), “Sectoral Patterns of Technical Change: Towards a Taxonomy and a Theory”, Research Policy, vol. 13, no 6, p. 343-373.
Pavitt K., Robson M. and Townsend J. (1989), “Technological Accumulation, Diversification and Organisation in UK Companies”, Management Science, vol. 35, no 1, p. 81-99.
Schumpeter J. (1942), Capitalism, Socialism, and Democracy, New York, Harper and Brothers.
Silverberg G. and Soete L. (eds.) (1994), The Economics of Growth and Technical Change, Aldershot, Edward Elgar.
Soete L. and Miozzo M. (1990), Trade and development in services: a technological perspective, Maastricht, Netherlands, MERIT.
Solow R. (1957), “Technical Change and the Aggregate Production Function”, Review of Economics and Statistics, vol. 39, no 3, p. 312-320.
Sundbo J. (1998), The Organization of Innovation in Services, Roskilde, Denmark, Roskilde University Press.
Tether B. (2005), “Do Services Innovate Differently? Insights from the European Innobarometer Survey”, Industry and Innovation, vol. 12, no 2, p. 153-184.
Tether B. and Howells J. (2007), “Changing Understanding of Innovation in Services. From Technological Adoption to Complex Complementary Changes to Technologies, Skills and Organization”, in DTI 2007. “Innovation in Services”, DTI Occasional Paper no 9, p. 21-62.
The World Bank (2018), “World Bank national accounts data”. Available at: http://databank.worldbank.org/data/reports.aspx?source=2&country (retrieved on July 8, 2019).
Zagaceta-García J.C. (2016), Service firm innovation: Disaggregated classification analysis for México. 26th Annual RESER (European Association for Research on Services) Conference, September.
66Appendix

1 jczagaceta@iteso.mx. Doctorado en Estudios Económicos. Universidad de Guadalajara, CUCEA. Periférico Norte 799, Núcleo Universitario Los Belenes, 45100, Zapopan, Jalisco, México.
2 NAICS’ economic classification from highest to lowest is: sector, sub-sector, branch, sub-branch, class.
3 According to Miles (1995), around 80% of IT investment is consumed by the service sector in the United Kingdom and the United States.
4 Sectors 48-49, which correspond to Transportation and Warehousing, are excluded from this census.
5 Sectors 55 and 62, which correspond to Management of Firms and Enterprises and Health care and Social assistance, respectively, are excluded from this census. The number of questions for the 2009 Census was increased and it used the “Open Innovation” approach, defined as “Deliberate use of inputs and outputs of knowledge to accelerate internal innovation, and expanding the use of innovation markets respectively” (Chesbrough, 2006), with an emphasis “on the way to use, manage, apply and also to generate intellectual property” (Herzog, 2008). Besides, this census has more questions on the use of ICTs.
6 Company-level data are not available for reasons of confidentiality, but also for certain variables of some branches and sectors. This is in accordance with the law of the National System of Statistical and Geographical Information, in articles 37, 38, 42 and 47.
7 The sector is Administrative and Support and Waste Management and Remediation Services for both censuses. The branches are: Retail trade in supermarkets; Retail trade in department stores; Parks with recreational facilities and electronic gaming also for both censuses. “Ambulances, organ banks and other ancillary services to medical treatment” for the 2004 Census and “Foreign package delivery services” for the 2009 census.
- CLIL theme: 3306 -- SCIENCES ÉCONOMIQUES -- Économie de la mondialisation et du développement
- ISBN: 978-2-406-11028-6
- EAN: 9782406110286
- ISSN: 2555-0284
- DOI: 10.15122/isbn.978-2-406-11028-6.p.0049
- Publisher: Classiques Garnier
- Online publication: 10-19-2020
- Periodicity: Biannual
- Language: English
- Keyword: service innovation, technological change, developing countries, Mexico, censuses