
Le travail « gig » et indépendant dans les métropoles américaines et les activités de services
- Type de publication : Article de revue
- Revue : European Review of Service Economics and Management Revue européenne d’économie et management des services
2020 – 1, n° 9. varia - Auteur : Harpel (Ellen)
- Résumé : L’une des caractéristiques de la nature changeante du travail est une augmentation du travail « gig » et indépendant, qui comprend une diversité d’activités à temps plein et à temps partiel qui génèrent un revenu en dehors d’une relation employeur-employé. Aux États-Unis, la plupart de ces emplois ont lieu dans les services. Cet article décrit les caractéristiques et les implications du travail « gig » et indépendant dans un certain nombre de métropoles américaines et dans l’ensemble des États-Unis, en mettant l'accent sur son rôle dans certaines activités de services.
- Pages : 153 à 176
- Revue : Revue Européenne d’Économie et Management des Services
- Thème CLIL : 3306 -- SCIENCES ÉCONOMIQUES -- Économie de la mondialisation et du développement
- EAN : 9782406106043
- ISBN : 978-2-406-10604-3
- ISSN : 2555-0284
- DOI : 10.15122/isbn.978-2-406-10604-3.p.0153
- Éditeur : Classiques Garnier
- Mise en ligne : 06/05/2020
- Périodicité : Semestrielle
- Langue : Anglais
- Mots-clés : Économie du « gig », avenir du travail, travail flexible, travail indépendant, services, services intensifs en connaissances, États-Unis, métropoles
Gig and Independent Work
in US Metropolitan Economies
and Service Industries
Ellen Harpel
Business Development Advisors LLC
Introduction
The gig economy and independent work arrangements receive much attention, but their role in regional economies is not well understood. In communities across the United States, growing numbers of people are working outside of wage and salary employment positions, and businesses are increasingly incorporating contract, independent, and freelance workers into their operations.
The changing nature of work has been described as the top trend affecting industries in the United States, based on a global survey of business executives. Gig and independent work is one important element of the overall changing nature of work. Service industries – such as professional services, media and information – are likely to be disproportionately affected by these trends and also tend to be among metropolitan areas’ leading industries (World Economic Forum, 2016).
This is not just a business phenomenon. Demographic changes suggest more individuals will be creating their own jobs or earning income through gig and independent work arrangements. By doing so they can experience greater flexibility, earning opportunities, and control in 154their work lives. The downside is that the associated earnings are less secure and more unpredictable. Gig and independent workers are also less likely to have health insurance or retirement accounts and are not covered by unemployment insurance.
Gig and independent work, therefore, has wide-ranging social and economic implications for metropolitan areas, including new opportunities for work, effects on income distribution, changes in quality of work and income stability, evolving employment models, and economic competitiveness.
The structure of this paper is as follows. Section 1 provides an overview and definitions, then suggests a typology for the different aspects of gig and independent work. Section 2 builds from the typology and uses available US federal data sources to convey the size and scope of gig and independent work in the US as a whole and in a set of metropolitan economies. Section 3 examines the interplay of gig and independent work and US services industries. Section 4 offers implications of these findings for researchers and policymakers, followed by the conclusion.
1. Overview of gig and independent work
1.1. What is gig and independent work?
One of the challenges in creating a common understanding around the changing nature of work and the shift away from full-time wage and salary employment is the multitude of terms and definitions used to capture the different ways we work. We counted 17. There are probably more. Another difficulty is that this phenomenon is often defined by what it is not: it is not a full-time job with a single employer covered by unemployment insurance. This means it is often not included in the labor market information that we use to understand state and local economies. The challenge is determining how to use available economic data to describe what it is and what it means for the US and its metropolitan economies.
155Conceptually, gig and independent work includes a variety of full-time and part-time activities for earning income outside of an employer-employee relationship. This work is often temporary or project-based, involves different customers and colleagues, and likely does not occur in the same way every day. It is frequently self-directed and often requires the individual to play the role of employer as well as employed. “Gig and independent” suggests positive connotations of freedom, flexibility, ownership, and self-reliance but also entails downsides, such as insecurity and unpredictability.
Gig and independent work is much more than driving for Uber or Lyft. It includes many types of people working in diverse ways for different purposes, comprising:
–Freelancers, such as writers or graphic designers;
–Professionals starting a side business in their field, such as consultants;
–Seniors or those with second-act careers seeking to stay active and earn income but with greater control and schedule flexibility as they age;
–Workers seeking to supplement inadequate or unpredictable income through temporary or “gig” activities;
–Individuals who can’t find employment and do gig jobs or temp work to get by;
–Workers classified as independent contractors, often engaged in saIes, construction, or professional occupations;
–Contract, on-call, or temporary workers;
–Entrepreneurs initiating a business idea;
–People who see greater career and income potential as an independent contractor rather than as an employee but who don’t seek to grow a business;
–Students, parents and caregivers who wish to earn extra income but who need to set their own schedule in order to meet other commitments; and
–Individuals pursuing the money-making potential of a personal interest or hobby, such as photography or personal fitness.
156Some studies indicate that gig and independent work is a positive phenomenon for individuals because it provides greater control, flexibility and/or income potential than traditional jobs. For others, however, it reflects a necessity rather than a choice. Some gig and independent workers wish to have a regular full-time job, but find themselves in gig, temporary or on-call work that provides neither the desired level of income nor any control. The data we have examined also suggest that many of these workers fall into low-income categories, and it is not clear if this is a welcome source of additional income, reflects a lack of other quality work opportunities, or both. And for yet others, it is somewhere on a continuum between necessity and choice – perhaps the best available option for a given time and place in their lives. Gig and independent work may be a temporary response to personal and economic conditions/opportunities rather than a permanent career choice.
1.2. How important is gig and independent work?
A variety of federal and private sector reports citing labor, business, and income statistics provide insights into different aspects of gig and independent work, but none offers a complete picture because each uses different definitions and draws from different pools of data using different methodologies. For this reason, the numbers and the baselines can’t simply be aggregated.
Figure 1 summarizes growth trends for several proxy measures of gig and independent work (shown in the dashed lines) for the US and compares them to population and wage and salary employment trends. Non-employer establishments and nonfarm proprietorships are increasing at a much faster rate than either the population or wage and salary employment. Full-time self-employment is growing again but continues to lag all other measures.
157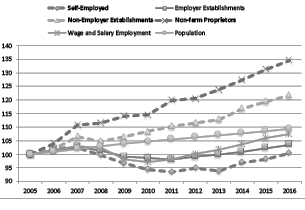
Fig. 1 – Change in Gig and Independent Work, Employee Work, and Population. US 2005-2016 (2005=100). Source: US Census Bureau (Non-employer Statistics, County Business Patterns, American Community Survey)
and Bureau of Economic Analysis.
The data behind Figure 1 show that some measures of gig and independent work have grown, while others, especially self-employment, have not. Similarly, some prominent national studies indicate gig and independent work is large and growing, while others suggest the impact is actually quite small and declining. Which is it?
1.3. Typology of gig and independent work
The answer to the question depends on what exactly is being measured. We have summarized findings from several sources to explain and present a typology for thinking about the different ways of conducting gig and independent work that helps us understand its economic role.
1581.3.1. Online platform economy
The term gig economy sometimes refers to the entire category of non-employee work, but it can also mean a much narrower set of activities performed in conjunction with an online platform, such as Uber, Lyft, Airbnb, etc. Although growing, the online platform economy segment still comprises a small portion of the overall economy. For example, JPMorganChase found that 1 % of adults earned income from an online platform in a given month, and 4 % had participated at some time over a 3-year period, indicating occasional rather than regular work (Farrell et al, 2016). Similarly, Office of Tax Analysis (OTA) researchers within the Treasury Department reported that only 0.7 % of all workers filed returns including income from participation in an online platform-based business, though underreporting likely occurred (Jackson et al., 2017).
1.3.2. Primary job
The self-employed and independent contractors are those we often think of when we consider “independent” workers. Data from the Bureau of Labor Statistics (BLS) show that 10.1 % of US workers (15 million people) were self-employed in 2015, but that the self-employment rate has been declining for the past two decades (Hipple and Hammond, 2016). Independent contractors1 are not the same as the self-employed though there is overlap. BLS survey findings on Contingent and Alternative Employment Arrangements indicate independent contractors account for 6.9 % of total employment (10.6 million people).
The survey on Contingent and Alternative Employment Arrangements also examined several other worker categories beyond independent contractors. Many were surprised that the survey found fewer workers in contingent and alternative employment arrangements in 2017 compared to 2005, the last time the survey was conducted (Paquette and Long, 2018; Winick, 2018; Morath, 2018). In the most recent iteration of the survey, 3.8 % of workers were considered contingent (did not expect their employment to continue past one year) and 10.1 % were considered 159to have alternative arrangements, including independent contractors, on-call workers, temporary help agency workers, and workers provided by contract firms.
A slower than expected evolution in the changing nature work, a stronger economy with more traditional jobs available, and the nature of the survey questions (which could be confusing to respondents) have been offered as possible explanations for the unexpected survey findings. These sources also focus on the primary job or job worked in the last week, which could mask the number of people who have done or currently do gig or independent work in a supplemental capacity.
1.3.3. Business activity
By contrast, the Department of the Treasury’s Office of Tax Analysis (OTA) has used tax data to demonstrate that a “rising share of American workers are earning income outside of traditional employee-employer relationships” through self-employment and business ownership. In 2014, nearly 25 million individuals filed tax returns reporting the operation of a nonfarm sole proprietorship – a 34 % increase from 2001. Individuals with self-employment earnings are about 12 % of the workforce, and 15.4 % of all filers with earnings included a Schedule C (Profit of Loss from Business) with their filings.
Drawing from data on business expenses, OTA also concludes that the characteristics of the self-employed have changed, because most of the growth has been associated with individuals who are primarily providing labor services (that is, they have few business expenses). In other words, the level of small business ownership among the self-employed has not changed significantly, but the number of independent contractors, freelancers, or potentially misclassified workers has grown (Jackson et al., 2017).
Tax data also support counts of proprietorships (owners of unincorporated businesses) and non-employer establishments (businesses that have no paid employees) from the Bureau of Economic Analysis and US Census, both of which can be used to estimate the amount of gig and independent work in the US economy. They have found there were 41.8 million nonfarm proprietors in the US in 2016, a 77 % increase from 1997 (Bureau of Economic Analysis, 2016), and 24.8 million 160non-employer establishments, a 60 % increase from 1997 (US Census, 2016). Their growth has far exceeded the expansion rates for employer businesses and the population as a whole.
1.3.4. Occasional participation
Finally, consulting firms, policy organizations and industry groups release their own reports examining gig and independent work that primarily rely on surveys and use different means of measuring activity. These reports tend to identify much higher levels of gig and independent work than the other sources. To cite a few recent examples:
–The 2017 Freelancing in America survey determined that 36 % of the US workforce (57 million people) is freelancing, with 30 % doing so full-time. The report suggests freelance work grew three times faster than the US workforce since 2014, yielding $1.4 trillion in earnings.
–The 2018 State of Independence in America report (MBO Partners, 2018) based on an online survey indicated 41.8 million people in the US are independent workers, a 2.2 % increase over 2017, generating $1.3 trillion of revenue for the US economy (6.7 % of GDP). The report states, “47 % of the US adult workforce reports either currently working or having worked as an independent contractor at one time during their career.”2 A separate report from the same source estimates independents as 32 % of the US workforce (MBO Partners, 2017).
–A Gallup study released in August 2018 and based on a survey of working adults estimates that “36 % of US workers are in the gig economy (Gallup, 2018).”
To summarize, a rough rule of thumb is that 1 percent of all US workers are engaged in online platform work, which tends to be supplemental to other income sources; about 10 percent have gig or independent work (or other “alternative employment arrangements” such as temporary or contract work) as their primary job; and an estimated 16130-40 percent of workers currently are or have freelanced or worked independently, either as a primary or secondary “job.” The latter figure shows that gig and independent work is becoming a more common part of the work experience for individuals.
2. Gig and independent work in the US
and select metropolitan economies
This section builds on previous work by the author (Harpel, 2018) combining multiple data sources to construct an understanding of gig and independent work at the metropolitan level.
Data were obtained from US federal data sources, including the Bureau of Labor Statistics, Bureau of Economic Analysis, US Census, and Office of Tax Analysis. These data sources describe characteristics of self-employment, non-employer establishments, proprietors, and income from business and professional activities. None of these categories alone captures the full scope of gig and independent work, but together they form a picture of how this type of work engages people and generates income.
Data for the US as a whole and a set of US metropolitan areas are analyzed and compared, where possible. The metropolitan areas selected include Atlanta, GA; Detroit, MI; Houston, TX; Phoenix, AZ; San Francisco, CA; and Washington, DC. These metropolitan areas were chosen from among the top 15 metropolitan areas by population to represent different regions of the country and diverse economies with different historical drivers.
2.1 Self-employment
Self-employment data come from the US Census Bureau’s American Community Survey (ACS). The ACS is a household survey with limited questions on employment and no details on firm size, age or profits (Christnacht et al., 2018). Respondents report their employer type, and self-employed is one of the given options. The self-employment response is “based on an individual’s current, primary job or the most recent job 162held within five years if not currently working.” The primary job “is the one in which they worked the most hours the previous week” and is not limited to full-time employment. Self-employment, therefore, is helpful as one indicator of independent work, but does not capture other elements of gig work.
Approximately 10 % of US workers (15 million people) are self-employed. In metropolitan areas, recent data show self-employment rates are largely holding steady, but with some interesting variations across cities. For example, self-employment rates have declined in Detroit, San Francisco, and Washington, DC, while they have increased slightly in Atlanta, Houston, and Phoenix. Our working hypothesis is that traditional employment metrics (wage and salary jobs covered by unemployment insurance) improved at a faster rate in the cities where self-employment as a primary job has declined, whereas Atlanta, Houston, and Phoenix may have experienced less quality job growth. Our research findings for the vibrant Washington, DC, metropolitan economy supports this notion (Harpel, 2018).
2.2 Non-employer establishments
In contrast to the self-employment trend, non-employer establishments have grown substantially in the US and among most of this set of metropolitan areas over roughly the same period (Figure 2). Non-employer establishments have no paid employees, have annual business receipts of at least $1,000, and are subject to federal income tax. Statistics on non-employer establishments are not based on business or household survey data, but instead are drawn from tax returns. They represent business activity rather than an individual’s class of work.
In the US, non-employer establishments substantially outnumber employer establishments by roughly 3:1. The ratio is higher in the metropolitan areas examined here, with, for example, Atlanta and Houston having more than 4 times as many non-employer establishments as employer establishments (data not shown). Of course, many more people work for employer establishments. While the number of non-employer establishments is growing rapidly, most people still work for employers.
There are approximately 24.8 million non-employer establishments in the US, a 60 % increase from 1997 and a 9.1 % increase since 2012. Over this same period, employer establishments only grew 4.4 % in the 163US. However, the number of paid employees at employer establishments – an important point of comparison if we are interested in individual workers as opposed to business activity – grew 9.3 %.
Across the metropolitan areas examined here, growth rates substantially exceeded the US rate, except in Detroit, which has had exceptionally low growth in non-employer establishments (Figure 2).
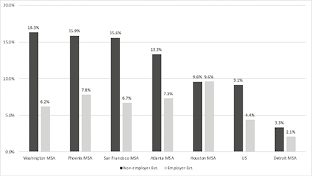
Fig. 2 – Percentage Change in Non-employer and Employer Establishments, 2012-2016. Source: US Census Bureau
(Nonemployer Statistics, County Business Patterns).
While the numbers have been increasing, receipts per establishment (a proxy for earnings) have declined relative to the average payroll per employee. In fact, non-employer establishments have become less lucrative compared to payroll jobs than they were before 2009. This finding implies that the type of work conducted by non-employers is changing to lower value activities (or at least lower valued compared to payroll work) or that non-employers work fewer hours than in previous years, or possibly both. Since the additional non-employers do not also identify as self-employed, it is likely that the growth represents gig or supplemental activities.
While growth in these establishments has been greater at the MSA level than in the US, the earnings per establishment are lower. At the 164metropolitan level, San Francisco is the only location where receipts per establishment significantly outpace the US level.
The Washington MSA suggests why this might be the case. Washington, DC, has seen a substantial divergence in non-employer receipts and payroll per employee over the past decade. The inflation-adjusted receipts per non-employer establishment in the Washington region have declined to just over $46,000 in 2016 from nearly $60,000 in 2005. By comparison, payroll per employee has climbed to over $65,000.
The decline in non-employer receipts relative to payroll over the past decade supports the notion that this work is shifting away from primary job status. Our hypothesis is that the growth has largely been in gig and independent work that has resulted in lower receipts, whether due to the number of hours worked (side hustles) or type of work performed (driving, for example, instead of professional services).
2.3 Proprietors
Proprietors are owners of unincorporated businesses, which primarily consist of sole proprietorships and partnerships. These unincorporated businesses may or may not have employees. Proprietors employment was 44.3 million in the US in 2017, a 34 % increase from 2005, compared to a 9 % increase in wage and salary employment over the same period. Metropolitan areas typically experienced an even more substantial change, with proprietors employment increasing up to 50 or 60 % since 2005.
Another trend emerges when examining data since 1997 (Figure 3). Proprietors employment used to be counter-cyclical, increasing when wage and salary employment was declining or growing slowly. However, since 2011, proprietors and wage and salary employment are more closely tracking. Data for metropolitan areas indicate the same trend over this period (data available upon request). This may be an indicator that the nature of proprietors’ work is changing from a primary to a supplemental activity, as we surmise with nonemployers.
165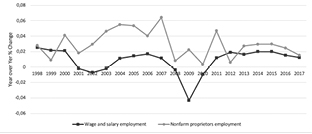
Fig. 3 – Year over year change in proprietors and wage & salary employment, US, 1997-2017. Source: US Bureau of Economic Analysis.
2.4. Business activity from tax returns
Proprietor and non-employer establishment data are derived from tax filings. Examining tax return characteristics directly can provide additional insights into the level and growth of gig and independent work. Tax forms may include a Schedule C (filed along with individual Form 1040), which is used to report income or loss from a business that the filer operated or from a profession practiced as a sole proprietor.
17 % of total tax returns in the US included a Schedule C in 2016, up from 13.8 % in 2000. Over the past decade, the number of tax returns with Schedule C grew much faster (16 %) than the number of returns with wage and salary income (7 %).
Tax data also reveal the distribution of individual business and professional net income by income level. While people of all income levels are engaged in gig and independent work as measured by Schedule C activity, middle-income earners are less likely to do so compared to lower- and upper-income filers. For example, in the US, 16 % of returns that included Schedule C have total income under $10,000 compared to 14 % of all returns. At the high end, 7 % of returns with a Schedule C report total income over $200,0000 compared to 5 % of all returns (Table 1).
166Tab. 1 – Percent of individual tax returns by income range and select source,
US 2016. Source: IRS.
|
Adjusted Gross |
All Returns |
Returns with salaries and wages |
Returns with business or professional net income |
|||
|
US |
Washington MSA |
US |
Washington MSA |
US |
Washington MSA |
|
|
Under $1 |
1 % |
1 % |
0 % |
0 % |
1 % |
2 % |
|
$1-$9,999 |
14 % |
12 % |
13 % |
10 % |
16 % |
17 % |
|
$10,000-$24,999 |
22 % |
16 % |
21 % |
15 % |
26 % |
18 % |
|
$25,000-$49,999 |
24 % |
20 % |
25 % |
21 % |
17 % |
15 % |
|
$50,000-$74,999 |
13 % |
14 % |
14 % |
14 % |
11 % |
11 % |
|
$75,000-$99,999 |
9 % |
10 % |
9 % |
10 % |
8 % |
8 % |
|
$100,000-$199,999 |
13 % |
19 % |
13 % |
20 % |
14 % |
19 % |
|
$200,000+ |
5 % |
9 % |
5 % |
9 % |
7 % |
11 % |
|
Total |
100 % |
100 % |
100 % |
100 % |
100 % |
100 % |
These figures likely vary substantially by metropolitan area. For example, research prepared for the Washington, DC, MSA found higher proportions of filers with Schedule C activity at upper income levels compared to the US. Specifically, 30 % of Washington, DC, MSA Schedule C filers reported total income over $100,000, compared to 21 % in the US.
3. Gig and independent work in US service industries
Service industries account for the majority of gig and independent work in the US and at the metropolitan level. Gig and independent workers, in turn, comprise notable proportions of certain service industries. Among the nearly 15 million self-employed in the US in 2017, approximately 11.4 million (76 %) are in the service industries. Of the 24.8 million non-employer establishments, roughly 21.7 (88 %) million are in service industries.
167Breaking this down further, Figure 4 shows the industries in which the self-employed are more active compared to the total working population. For example, 14 % of the self-employed are in Professional Services compared to 7 % of the total working population. Leading service industries by this measure are Professional Services, Other Services, and Administrative Services.
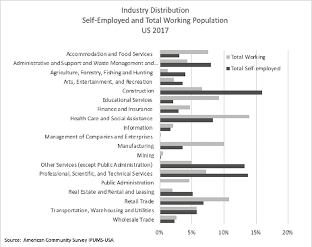
Fig. 4 – Industry Distribution of self-employed and the total working population, US 2017. Source: American Community Survey IPUMS-USA.
Figure 5 provides a tally of non-employer establishments by industry. Again we see a strong presence in Other Services, Professional Services, and Administrative Services, as well as Retail and Real Estate.
168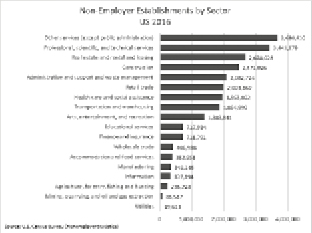
Fig. 5 – Non-employer establishments by industry, US 2016.
Source: US Census Bureau Nonemployer Statistics.
At the MSA level, this concentration in service industries is more pronounced. While 76 % of US self-employment is in service industries, the range for the MSAs considered here is 79 % (Detroit) – 87 % (San Francisco). The MSA and US national figures are more similar for non-employer establishments, with approximately 85-90 % nonemployers active in service industries.
Leading service industries by both measures remain Administrative Services, Other Services, and Professional Services. Within specific service industries, we start to see some differentiation among MSAs. For example, the self-employed in Houston, Detroit and Phoenix are more concentrated in Construction, Administrative Services, and Other Services, whereas in San Francisco and Washington they are highly concentrated in Professional Services.
Similarly, Professional Services and Other Services are consistently the leading industry categories among nonemployer establishments, 169but Real Estate (Detroit, Phoenix, Washington) and Transportation and Warehousing (San Francisco, Washington) may break into the top five, depending on the location.
The next three sections provide more detail at the MSA level for two of the leading service sectors for gig and independent work plus one service sector (transportation and warehousing), which has received substantial attention and experienced tremendous growth in recent years.
3.1. Professional Services
The Professional, Scientific & Technical Services (professional services) industry includes consultants, lawyers, accountants, computer services, and research activity. It is one of the dominant industry categories for gig and independent work at the national and metropolitan levels.
In the US professional services represents approximately 7 % of all employment, but 14 % of non-employer establishments and 14 % of the self-employed. The number of nonemployer professional services establishments grew 7.1 % between 2012 and 2016. Average receipts per establishment were $46,257.
Metropolitan level data indicate that professional services play a larger role in urban economies than in the US as a whole, accounting for 9-17 % of total employment. 15-23 % of the self-employed and 12-23 % of non-employer establishments are involved in professional services, so gig and independent work is also a more important part of their professional services industries. Receipts per establishment are generally higher in metropolitan areas, although Atlanta and Detroit are exceptions.
Professional services account for a sizable segment of gig and independent work, but the reverse is also true. In the US, 18 % of all workers in professional services are self-employed, with a range of 11 %-20 % across this set of MSAs.
3.2. Other Services
The Other Services industry includes repair and maintenance work, personal care services (such as salon services or personal trainers), and religious, civic or professional organizations. It is a catchall category 170that happens to include many types of activities often performed by individuals rather than companies or as a part-time or side business.
In the US, other services represents approximately 5 % of total employment, but 15 % of non-employer establishments and 13 % of the self-employed. The number of nonemployer other services establishments grew 4.5 % between 2012 and 2016. Average receipts per establishment were $27,274.
Metropolitan level data show that other services play a similar role in urban economies compared to the US as a whole accounting for 5-6 % of total employment. As in the US, the other services sector is an important component of gig and independent work, with 10-15 % of the self-employed and 10-18 % of non-employer establishments involved in other services. However, the number of nonemployers in the other services industry have grown much more rapidly in most cities considered here compared to the US (with the exception of Detroit). Receipts per establishment are also generally higher in metropolitan areas than in the US as a whole, but Atlanta and Detroit are again exceptions.
Gig and independent workers are an important component of the other services industry. In the US, 25 % of all workers in other services are self-employed, with a range of 15 %-28 % across this set of MSAs.
3.3. Transportation and Warehousing
Transportation and Warehousing includes taxi and limousine services, as well as all other transportation modes, sightseeing transportation, couriers, and warehousing and storage activities. It includes the ride sharing services that dominate much of the discussion about the gig economy.
As the data show, it is a significant segment of gig and independent work, but it is not one of the leading industry categories in which this type of work occurs. In the US, transportation and warehousing accounts for approximately 6 % of total employment, but 8 % of non-employer establishments and 6 % of the self-employed. However, the growth trend has been notable. The number of non-employer transportation and warehousing establishments grew 76 % between 2012 and 2016 while self-employment expanded 45 %. Average receipts per establishment were $46,635.
171Metropolitan level data indicate that transportation and warehousing plays a slightly smaller role in urban economies than in the US as a whole, accounting for 4-8 % of total employment. It is not one of the largest components of gig and independent work, with 6-11 % of nonemployer establishments and 5-7 % of the self-employed. Nevertheless, its growth rates in some metropolitan areas has been even higher than at the national level, especially in prosperous locations such as San Francisco. and Washington, DC. Receipts per establishment are also notably lower in metropolitan areas, although Houston and Detroit are exceptions. It is likely that other elements of this industry rather than ridesharing account for the higher receipts in those cities.
4. Implications for Researchers and Policymakers
Across the US, growing numbers of people are working outside of full-time, covered employment positions, and businesses are increasingly incorporating contract, independent, and freelance workers into their operations. Learning more about the changing nature of work, including gig and independent work, is a business and economic imperative.
Since there is no single definition or data source, economic researchers in the US have struggled to understand and convey the role that gig and independent work plays in the economy. Researchers need to look beyond basic labor market information sources since gig and independent work can be invisible within the primary economic data we typically use to study regional economies. This paper describes a typology that can help make sense of the varied categories of gig and independent work and suggests readily accessible federal sources for national and regional data.
It is also becoming clear that gig and independent work has several wide-ranging social and economic implications for national, state, and local policymakers. Gig and independent work is a growing and substantial part of the economy, affecting the competitiveness of industries and income-earning opportunities for residents. The data show that gig and independent work plays an important role in several leading 172industries. Establishments of all types (including small businesses and government) are using gig and independent workers more frequently to supplement their wage and salary workforce.
Policy considerations affecting workforce development, public economic development work, and social policies include:
Effect on income distribution: Examinations of earnings among gig and independent workers show a barbell effect, with concentrations at both the low end and high end of the income spectrum. It is not clear if gig and independent work exacerbates or ameliorates income disparities.
New opportunities for work: Because it offers low barriers to entry and schedule flexibility, gig and independent work may provide new opportunities for individuals who do not have a wage and salary job or for whom conventional work arrangements are not feasible, especially for individuals who face barriers to full-time employment or need to balance work with school, family or caregiving commitments.
Quality of work and income stability: Economists and policy makers are concerned about income and job stability in both the traditional job market and among gig/independent workers in the US. Researchers have found that 41 % of individuals experience more than a 30 % change in income on a month-to-month basis whether in a traditional, gig, or independent position. (Farrell and Greig, 2016). Again, it is not clear if gig and independent work eases or worsens this situation.
Changing employment models: Businesses and governments are increasingly using a combination of traditional employees and gig and independent workers in their operations. One industry study found that 44 % of workforce spending among surveyed companies goes to the external workforce including non-payroll workers (contractors, consultants, temporary labor), outside service providers, and on-demand freelancers (Oxford Economics, 2018). These types of reports don’t carry the same weight as federal statistics, but they are useful indicators of current business thinking on gig and independent work.
The trend is not limited to large companies. A 2017 survey of US small business owners identified a 37 % increase in the hiring of gig workers over the past six months compared to a 13 % increase for full-time employees. Nearly 20 % reported replacing employees with contractors over that same period (SCORE, 2017). State and local governments are following a similar pattern. A 2018 survey found 45 % had hired 173contract or temporary employees in the past year (Center for State & Local Government Excellence, 2018). Even “non-employers” use gig and independent workers: 47 percent reported doing so for an average of 3.2 workers per firm (SCORE, 2017).
Lack of a social safety net: While some individuals earn high incomes from gig and independent work (MBO Partners, 2018), in general they earn less and are less likely to have health insurance coverage or have a retirement account than wage and salary workers (Jackson et al., 2017). Most gig and independent workers are not eligible for unemployment insurance.
Nascent entrepreneurship: Much of the recent growth in gig and independent work is about generating labor income, not building a business. However, there remains a segment of gig and independent workers who fit more closely with our ideas of entrepreneurship. MBO Partners reports that 12 % of full-time independents and 18 % of millennials intend to build a larger business (MBO Partners, 2018). There is also evidence that some people engaged in online platform work see it as a “middle ground between working as an employee and starting one’s own business” (Thomas, 2017).
Worker flexibility: Gig and independent workers tend to value work and schedule flexibility–when they get to control the terms of that flexibility. Studies of the independent workforce consistently find that freedom and flexibility are top drivers of the decision to work independently, especially among those working full-time (Edelman, 2017). Demographic trends suggest that growing numbers of people will be seeking greater work flexibility through gig and independent activities.
These topics should be incorporated into policy conversations around issues such as career and technical education, economic development competitiveness, tax reform, worker benefits, workplace protections, and healthcare coverage that have substantial effects on the wellbeing of the growing numbers of gig and independent workers.
174Conclusion
Gig and independent work is growing in the US and its metropolitan economies, engaging millions of people who are working in a variety of ways outside of an employer-employee relationship. The characteristics of the recent growth in gig and independent work suggest a substantial portion is supplemental activity, rather than a primary job. However, there is a core for whom gig and independent work is full-time and/or their primary source of income. Gig and independent work can be a positive option for many individuals because it provides greater opportunity, control, flexibility, and income potential. For others, however, it represents a precarious necessity rather than a choice.
Gig and independent work plays an important supporting role in many leading service industries, including the high-value professional services sector. Establishments of all types are likely to expand their engagement of gig and independent workers as a complement to their employee workforce. Accordingly, more individuals can expect to find themselves engaged in gig and independent work at some point – or multiple points – over the course of their careers.
As the nature of work continues to evolve, forward-thinking leaders will increasingly incorporate gig and independent work activities into their economic policies and programs.
175References
Bureau of Economic Analysis (2016), US Economic Profile, US Department of Commerce, Washington DC.
Bureau of Labor Statistics (2018), Contingent and Alternative Employment Arrangements – May 2017, US Department of Labor, Washington DC.
Center for State & Local Government Excellence (2018), Survey Findings. State and Local Government Workforce: 2018 Data and 10 Year Trends, Washington DC.
Christnacht C., Smith A. and Chenevert R. (2018), Measuring Entrepreneurship in the American Community Survey: A Demographic and Occupational Profile of Self-Employed Workers, SEHSD Working Paper Number 2018-28.
Edelman Intelligence (2017), Freelancing in America, Commissioned by Upwork and the Freelancers Union.
Farrell D. and Greig, F. (2016), Paychecks, Paydays, and the Online Platform Economy, JPMorgan Chase & Co. Institute.
Gallup (2018), “What Workplace Leaders Can Learn from the Real Gig Economy”, citing The Gig Economy and Alternative Work Arrangements, available at https://www.gallup.com/workplace/240929/workplace-leaders-learn-real-gig-economy.aspx (accessed August 2018).
Harpel E. (2018), Gig and Independent Work in the Washington Region’s Economy, The Stephen S. Fuller Institute, Schar School of George Mason University.
Jackson E., Looney A. and Ramnath S. (2017), The Rise of Alternative Work Arrangements: Evidence and Implications for Tax Filing and Benefit Coverage. Working Paper 114. Office of Tax Analysis.
Hipple S. and Hammond L. (2016), Self-Employment in the United States, US Bureau of Labor Statistics Spotlight on Statistics, Washington DC.
MBO Partners (2017), Looking forward: What will the independent workforce look like in 2027? Herndon, VA, USA.
MBO Partners (2018), The State of Independence in America. 2018: The New Normal, Herndon, VA, USA.
Morath E. (2018), “Was the gig economy overblown?” Wall Street Journal, 7 June 2018.
Oxford Economics (2018), External Workforce Insights 2018: The Forces Reshaping How Work Gets Done. For SAP Fieldglass.
Paquette D. and Long H. (2018), “America’s gig economy is smaller now than before Uber existed, official data show”, Washington Post, 7 June 2018.
176SCORE (2017), The Megaphone of Main Street: Small Business Jobs Report.
Thomas K. D. (2017), “Taxing the Gig Economy,” University of Pennsylvania Law Review, vol. 166, no 6, p. 1415-1473.
US Census (2016), Non-Employer Statistics and County Business Patterns.
World Economic Forum (2016), The Future of Jobs. Employment, Skills and Workforce Strategy for the Fourth Industrial Revolution, Global Challenge Insight Report, January, Geneva, Switzerland.
Winick, E. (2018), “The US government is seriously underestimating how much Americans relay on gig work.” MIT Technology Review, 7 June 2018.
1 “Independent contractors are those who are identified as independent contractors, consultants, or freelance workers in the supplement, regardless of whether they are identified as wage and salary workers or self-employed in the basic CPS labor force status questions.” (Bureau of Labor Statistics, 2018)
2 Independent workers in this survey include consultants, freelancers, contractors, and temporary or on-call workers.