
Principaux attributs et descripteurs de l'image de la destination Vietnam Une analyse de contenu des évaluations en ligne effectuées à l’issue du voyage
- Type de publication : Article de revue
- Revue : European Review of Service Economics and Management Revue européenne d’économie et management des services
2019 – 1, n° 7. varia - Auteur : Luong (Ha V.)
- Résumé : L’image de la destination est considérée dans la littérature sur la marque de destination comme un concept important qui influence le choix et la fidélité des touristes. L’analyse des contenus générés par les utilisateurs sur les blogs de voyage et les forums touristiques est une méthode efficace pour explorer la structure de l’image de la destination. Cette étude qualitative vise à identifier des attributs et des descripteurs pertinents pour la construction de l’image de la destination Vietnam.
- Pages : 83 à 115
- Revue : Revue Européenne d’Économie et Management des Services
- Thème CLIL : 3306 -- SCIENCES ÉCONOMIQUES -- Économie de la mondialisation et du développement
- EAN : 9782406092308
- ISBN : 978-2-406-09230-8
- ISSN : 2555-0284
- DOI : 10.15122/isbn.978-2-406-09230-8.p.0083
- Éditeur : Classiques Garnier
- Mise en ligne : 20/05/2019
- Périodicité : Semestrielle
- Langue : Anglais
- Mots-clés : Image de la destination, attributs de la destination, contenus générés par les utilisateurs, Vietnam, analyse de contenu
KEY ATTRIBUTES AND DESCRIPTORS
OF VIETNAM DESTINATION IMAGE
A content analysis of online English post-trip-reports
Ha V. Luong 1
ESCP EUROPE Paris campus
Introduction
The growing importance of tourism in most countries and the fierce competition among the destinations around the world have led to an increasing interest in studying the factors that affect tourist buying behaviour. Tourism studies emphasize the role of image and provide empirical evidence that destination image, “the sum of all beliefs, feelings and impressions that people associate with a destination” (Baloglu & Brinberg, 1997; Baloglu & McCleary, 1999; Kim et al. 2017; Nadeau et al., 2008), is a valuable concept influencing tourist preferences, selection processes, intentions to visit, and recommendations. Understanding the image that visitors have is of great importance because it enables a possibility to integrate image attributes in marketing planning of tourist destinations.
In practice, Destination Marketing Organizations (DMOs) around the world put effortsto promote attributes such as beautiful beaches, mountains, scenery… to develop a positive destination image in mind of tourists. However, nowadays those functional attributes are no longer helpful in creating the difference and uniqueness for a destination because tourists can find them in most of destinations.
84Recent studies in destination image (Hosany & Ekinci, 2003; Hosany et al. 2006; Kumar, 2016; Kumar & Nayak, 2014; Maher & Carter, 2011; Tosun et al. , 2015) have proven the significant impacts of emotional and symbolic attributes of a destination on tourist behaviours. Some studies found that even tourist have a number of positive beliefs but yet still have negative feelings toward the destinations (Nael et al., 1999; Bigné et al., 2001 cited in Abdul Rashid & Ismail, 2008). Tourists might evaluate the same belief differently and yet the potential tourists’ affective responses are unpredictable. The affective perspective of destination perception therefore needs more studies to be refined.
Vietnam is an emerging tourism destination in recent years. The total contribution of Travel & Tourism to GDP (including wider effects from investment, the supply chain and induced income impacts) was VND468,291.00bn in 2017 (9.4% of GDP) and is expected to grow by 6.2% to VND497,303.0bn (9.3% of GDP) in 2018. Travel & Tourism created 4,061,000 jobs in 2017 (7.6% of total employment). This is forecast to rise by 1.4% in 2018 to 4,117,000 jobs (WTTC, 2018). As other destinations, the country has been facing fierce competition from its competitors in the region such as Singapore, Malaysia, Thailand and Taiwan which have developed their strong destination image for years. Traditional European markets are showing upward growth but at slower rates in recent years (VNTA, 2017).
In order to differentiate itself from others, Vietnam also need to shift its branding strategy of promoting functional attributes to symbolic ones as suggested by recent literature. The academic research on Vietnam include several studies conducted by Cooper (2009), Truong & King (2009), Bui (2011), Loi & Sentosa (2014), Khuong & Ha (2014). However, most of them mainly pay their attention to capturing cognitive/functional/tangible attributes of destination image. The feeling international tourists had towards the country (emotional/affective descriptors) were not fully examined to provide scientific background for Vietnam policy makers.
With all above mentioned reasons, this exploratory qualitative study aims at contributing to the development of destination branding both in practice and theory by, first, identifying specific attributes and dimensions that make up the destination image of Vietnam in mind of 85international tourists after their trip to the country, and second, creating a pool of destination image descriptors which are specific to Vietnam for further quantitative investigations.
1. Literature review
1.1 Destination image
The concept of destination refers to locations visited by tourist that are either (1) towns, (2) regions or (3) countries (Jenes, 2012). A tourism destination can also be seen as a product or perceived as a brand since it consists of a bundle of tangible and intangible attributes. In the early 1970s, Hunt (1971, 1975), Gunn (1972), and Mayo (1973) introduced the concept of brand image into tourism study (Cited in Nghiêm Phú, 2014).
The study on destination image started with the perceived images of a destination, and nowadays this study line is still dominating the field (Nghiêm-Phú, 2014). Studies on destination image define the concept of destination image as “the expression of all objective knowledge, prejudices, imagination and emotional thoughts of an individual or group about a particular location” (Lawson & Baud-Bovy, 1977) or as the “sum of all beliefs, feelings and impressions that people associate with a destination” (Crompton, 1979)
Research of the past four decades has demonstrated that destination image is a valuable concept in understanding the destination selection process of tourists. Destination image is widely accepted to impact the behaviour of tourists pre-, during and post-visitation to the destination (Baloglu et al., 2014; Gartner, 1994; Goodall & Ashworth, 2013; Tasci et al., 2007). It influences tourists’ intention to visit the destination as well as the intention to recommend the destination to family, friends and other potential tourists (Castro et al., 2007). It has a great influence upon tourist behaviour and destination selection (Baloglu & McCleary, 1999; Gartner, 1994; Goodall & Ashworth, 2013).
861.2 Structure of Destination image
The image tourists have of a destination is largely subjective because it is based on the perceptions each tourist has of all of the destinations they have been to or have heard of (San Martín and Del Bosque, 2008). Destination image, therefore, is a multi-dimensional construct comprising of various components and attributes. Due to its complexity, the essence of destination image studies is to discover how people visualize, think, and feel toward places (Tasci, 2009). Due to its large number of elements and attributes (Aaker and Joachimsthaler, 2000), one important task for tourism researchers is to identify core components and specific attributes of a certain destination image before measuring it. There are three main streams regarding the conceptualization of destination image structure in the literature: 1) the attitude theory approach, 2) the human information processing theories approach, 3) destination as brand.
1.2.1 Attitude theory approach
Adopted from the attitude theory (Bagozzi, 1978; Breckler, 1984), it is generally agreed that destination image includes cognitive and affective components of attitude. Cognitive components refer to intellectual evaluations of known attributes of a destination, while affective components are feelings and emotions toward the destination. Beerli & Martin (2004a), Gartner (1994), Pike (2002), Tasci et al. (2007) and Baloglu and McCleary (1999) state that both components are interrelated. They also assert that affective component depends on a function of cognitive component, and that for a better prediction of behaviour they should be measured separately.
Cognitive image is usually measured through attributes. Zhou (2005) found that the most frequently used attributes of cognitive component are: (1) Culture & history (monument, heritage, arts, handcraft; (2) Landscape (beautiful scenery and natural attractions); (3) Services (shopping, accommodation, food, and transportation); (4) Entertainment; (5) Relaxation; (6) Climate (e.g., pleasant weather); (7) Price (e.g., cost, good value for money); (8) Sport; (9) Safety (personal safety); (10) Local people’s attitude toward tourists; (11) Special events and activities; (12) Accessibility (information available); (13) Adventure; (14) Wildlife; (15) Close to other destination(s); (16) Special animals.
87Regarding the measurement of affective component, Baloglu and Brinberg (1997) adapted a four affective space measurement scales invented by Russell and Pratt (1980) including descriptors which tourists used to describe an environment: arousing – sleepy, exciting – gloomy, pleasant – unpleasant, distressing – relaxing (see figure 1).
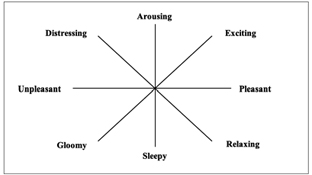
Fig. 1 – Affective image dimensions.
Source: Baloglu and Brinberg (1997).
The criticism on this measurement scale of affective image is that destination comprises of not only built environment but also products, services and people in that destination. Therefore, the affective image also needs to include descriptors of feeling tourists have toward those factors (Kim & Perdue, 2011; Kneesel et al., 2010).
1.2.2 Human information processing theories approach
One of the basic problems of tourist destination image research is that destination images are “holistic” representations of a place and that in attempting to measure them, researchers are compelled to look at the parts or attributes singularly (Jenkins, 1999). Echtner and Ritchie (1991) overcome this problem by proposing a model that includes attribute - holistic as one of three dimensions based on “Human information processing theories”.Basically, there are two different theories concerning human 88interpretation of environmental stimuli: (1) the first considers that an individual processes information about an object in terms of individual attributes, and (2) the second that an individual processes information about an object in terms of “gestalt” impressions. Some researchers accept that both ways of information processing are used when evaluating an object, which leads to conceptualization of image in terms of attribute and holistic components (Poiesz, 1989 cited in Tasci, 2009).
Echtner and Ritchie (1991, 1993) argue that people have images of both individual attributes (scenery, climate, price) and holistic impressions of a destination and they recommend that destination image has two main components: attribute-based and holistic; each component consists of functional (or more tangible) and psychological (or more abstract), as well as common and unique, characteristics. Attribute-based componentincludes perceptions of the individual characteristics of the destination. The holistic component of destination image consists of certain imageries such as the general feeling and atmosphere of a destination so it is something general or whole. In the common-unique continuum, attributes of the destination range from common attributes that can nearly be observed and felt in all destinations, to unique characteristics that are special for that destination (figure 2).
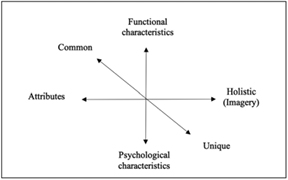
Fig. 2 – Components of destination image.
Source: Etchner and Ritchie (1991).
To measure the attribute-based and more common components, Etchner and Ritchie (1991) developed a scale with 35 items, ranging:
–from the more functional attributes (i.e. tourist sites/activities, national parks/wilderness activities, historic sites/museums, beaches, fairs/exhibits/festivals, scenery/natural attractions, nightlife/entertainment, shopping facilities, facilities for information and tours, sports facilities/activities, local infrastructure/transportation, cities, accommodation/restaurants, architecture/buildings, costs/price levels, and climate),
–the mixed attributes (i.e. crowdedness, cleanliness, degree of urbanization, economic development/affluence, extent of commercialization, political stability, accessibility, personal safety, ease of communication, customs/culture, and different cuisine/food/drink),
–to the more psychological attributes (i.e. hospitality/friendliness/ receptiveness, restful/relaxing, atmosphere – familiar vs. exotic, opportunity for adventure, opportunity to increase knowledge, family or adult oriented, quality of service, and fame/ reputation).
In order to capture the holistic and unique components, they created three open-ended questions: (1) what images or characteristics come to mind when you think of XXX as a vacation destination? (functional holistic/ stereotypical component), (2) how do you describe the atmosphere or mood that you would expect to experience while visiting XXX? (psychological holistic/affective component), and (3) please list any distinctive or unique tourist attractions that you can think of in XXX (unique component).
Etchner and Ritchie’s model has been widely applied in the studies of later period, especially the image attributes list and the open-ended questions (e.g. Hughes, 2008; Prebežac & Mikulić, 2008; Stepchenkova & Morrison, 2008; Stepchenkova & Li, 2012; Matlovičová & Kolesárová, 2012 cited in Nghiêm-Phú, 2014). However, there are some limitations regarding the applicability of Echtner and Ritchie’s model. It is hard to identify, and thus also place some of the components of the destination image in the right dimensional setting (Jenkins, 1999; Tasci et al., 902007). For example, it is difficult to distinguish between functional and psychological characteristics of a destination and its attributes. More precisely, the line between the proposed functional and psychological attributes is not very clear. Hence, it is somewhat complex to categorize images, such as for example perceived cleanliness, or personal safety as a complete functional or complete psychological attribute.
1.2.3 Destination as a brand
A tourism destination can also be seen as a product or perceived as a brand since it consists of a bundle of tangible and intangible attributes. Destination image, therefore, was treated as brand image in many studies (Prayag, 2010; Saraniemi, 2010; Hanzaee & Saeedi, 2011; Qu, Kim & Im, 2011; Bruwer & Lesschaeve, 2012; Naidoo & Ramseook-Munhurrun, 2012; Hosany & Ekinci, 2003).
In branding literature, a brand has three main benefits to consumer which are functional, experiential, and symbolic respectively. Orth and De Marchi (2007) state that a) Functional benefits are the more intrinsic advantages of product consumption and usually correspond to product attributes, and these benefits often are linked to basic motivations such as wellbeing and health; b) Experiential benefits are related to what it feels like to use the product and that also usually correspond to product attributes and these benefits satisfy experiential needs such as sensory pleasure cognitive stimulation; c) Symbolic benefits are the more extrinsic advantages of product consumption, and they usually correspond to non-product-related attributes related to underlying needs for social approval, personal expression, and outer-directed self-esteem.
Applying this approach to tourism destination context, Gnoth (2002), Hankinson (2004), Stephens et al. (2011) argue that destination can be also perceived by functional attributes, symbolic attributes and experiential attributes. According to Hankinson (2004), functional attributes include general attributes relating to the destination: accessibility, bars and restaurants, landscape/scenery, climate, price, quality of accommodation, utilitarian and environmental attributes. Symbolic attributes concern the character of the local population; the profile of typical tourists and the quality of the service and reception. Experiential attributes included descriptors of how destinations make tourists feel; the 91character of the built environment; and descriptors relating to security and safety. Linking symbolic and experiential dimensions, these two categories of attributes provide a set of holistic images mentioned by Echtner and Ritchie (1991).
Tab. 1 – Attributes of the destination image as a brand
Source: Hankinson (2004).
|
Potential functional attributes Museums, art galleries, theatres and concert halls Leisure and sports activities and facilities Conference and exhibition facilities, Public spaces Hotels, restaurants, night clubs and entertainment Transport infrastructure and access |
|
Potential symbolic attributes The character of the local residents The profile of typical visitors (e.g. age, income, interests and values) Descriptors of the quality of service provided by service contact personnel |
|
Potential experiential attributes How the destination will make visitors feel (e.g., relaxed, excited or fascinated) Descriptors of the destination’s feel (e.g. the city experience, vibrant or peaceful) The character of the built environment (e.g. historic, modern, green and spacious) Descriptors related to security and safety |
This approach shows an advantage over the two formers. It not only helps to clarify the meaning of “holistic image” proposed by Echtner and Ritchie (1991) but also emphasizes the importance of “people” perception by adding symbolic attributes to destination image structure. In this way, emotions and feelings tourists have towards a destination are not limited to the response to physical environments as conceptualized by Baloglu and Brinberg (1997) but they are also extended to people, products and services offered at the destination as suggested by Nadeau et al. (2008) and Elliot et al. (2011). It also implies that the descriptors a tourist uses to describe a destination are important cues to get into the affective dimension of destination image. Due to its advantage, we will follow on this approach to explore the structure of Vietnam Destination image.
922. Methodology
Qualitative methods have been increasingly recognized as a useful tool to reveal the holistic and psychological impressions associated with a destination that are not easily captured by quantitative methods (Reilly, 1990; Dann, 1996; Echtner & Ritchie, 2003; Mackay & Fesenmaier, 2000). Baloglu and Love (2005) investigated the association meeting planners’ images of five convention cities and found that open-ended (unstructured) questions revealed unique perceptions that could not be captured by closed-ended (structured) questions.
Among qualitative methods, content analysis has been frequently used in order to capture the structure of destination image (Neuendorf, 2002). It employs sorting and categorization techniques to identify the frequencies of certain concepts, words, or people in textual material and treats the most frequent ones as variables, or dimensions of the destination image construct (Stepchenkova & Mills, 2010). We will apply this method for analyzing collected data.
2.1 Data collection
The increasing popularity of Internet-based user-generated-content (UGC) applications such as blogs, personal websites, wikis, special interest forums, and travel review sites, serve as a platform for tourists to exchange information (Litvin et al., 2008), UGCs provide tourists an easy way to find information on a destination without the restrictions of time and space (Sandes & Urdan, 2013). By sharing post-visit experience, UGCs play dual role which are both as “perceived destination image” of past-tourists and as “projected destination image” for future tourists. They are becoming an important source of information available for researchers to capture main attributes of a tourism destination (Choi et al., 2007). Therefore, the content analysis of UGCs will shed light on the subjective opinion of tourists’ experiences of the attributes of a destination, allowing researchers to have a clear picture of tourists’ opinions. Content analysis has been defined as a systematic, replicable technique for compressing large amounts of textual information into fewer content categories (Riffe et al., 2005). Analysis of travel websites 93through content analysis gives a valuable insight on images of destinations (Larmolenko & Schneider, 2010)
This study will also analyze those UGCs in form of post-trip reports/entries posted on tourism forums or personal blogs to explore how tourists around the world perceive Vietnam as a destination after their visit. In those reports, people described experience and feelings they had during their stay in Vietnam.
10 assistants from 10 countries which are among key markets of Vietnam tourism (US, France, Australia, Canada, Spain, Germany, Finland, Japan, Singapore, Korea) were asked to collect 20 reports (in English) that they could found through Google’s search engine with 4 group of keywords: “Vietnam trip reports”, “Vietnam travel diary”, “Vietnam trip blogs”, “Vietnam travel experience”. Among final 200 collected reports, 83 are duplicates. It means there were only 117 ones in total that had actually been found. A set of selection criteria were then applied to retained reports: a) mentioning at least three sub-destinations in Vietnam; b) being posted within recent 5 years (i.e., not earlier than 2013); c) the duration of stay in Vietnam must be longer than 5 days; d) being published by tourists not by travel agents. After this step, a final collection of 80 trip reports is used for content analysis. It is a large textual corpus of 318,336 words in total created by tourists whose characteristics are described in table 2.
Tab. 2 – Tourists’ profile
Source: Author’s own elaboration.
|
Frequency |
Percentage (%) |
||
|
Gender |
Female |
49 |
61.25% |
|
Male |
31 |
38.75% |
|
|
Total |
80 |
100.00% |
|
|
Repeated tourist |
Yes |
12 |
15.00% |
|
No |
68 |
85.00% |
|
|
Total |
80 |
100.00% |
|
| 94
Duration |
5-10 days |
16 |
20.00% |
|
11-20 days |
43 |
53.75% |
|
|
More than 20 days |
21 |
26.25% |
|
|
Total |
80 |
100.00% |
|
|
Origin |
North America |
24 |
30.00% |
|
Asia |
6 |
7.50% |
|
|
Europe |
42 |
52.50% |
|
|
Other |
8 |
10.00% |
|
|
Total |
80 |
100.00% |
From table 2, some important facts are found. Firstly, 61.25% of the reports are posted by female. This implies that female tourists are more active on social media than male in blogging their experience during their visit as discussed by Ráthonyi (2013). The over representation of female respondents has been also observed in other studies on tourist’s social media use (Fotis et al., 2012; Kim et al., 2017; Trana et al., 2017).
There are only 12 out of 80 reports (15%) generated by repeated tourists. This fact reflects the low return rate of international tourists at 5% as stated by Khuong and Nguyen (2017) or under 10% according to many tourism experts.
More than 82.5% of tourists come from North America (30%) and Europe (52.5%). The explanation for this fact is that reports were written in English. Although China, Russia and other neighbor countries are big source of tourist arrivals, but English are not popular in those countries. It is a limitation of this study that the sample represents solely English-speaking tourists. However, North America and Europe are the two important markets for Vietnam and English contents are a dominant source of tourism information. A study on this sample still contributes relevant findings for Vietnam tourism.
952.2 Data Analysis
The text data collected was organized using the NVivo 12 software. The NVivo software also permits analyzing textual data, identifying the most frequently used words in a corpus and conducting cross relation analysis.
First of all, the textual data was cleaned. Words that do not carry a specific meaning (e.g. “the”, “as”, “it”, “where”) were removed. The plural nouns were transformed into singular (e.g. “cathedrals” to “cathedral”, and the words that in combination carry one specific meaning were unified into one-word format (e.g. “old quarter” to “oldquarter”, “Ha Noi” to “Hanoi”, “Ha Lon” to “Halong”, etc.). Also, words that do not carry any specific meaning and are widely used in travel-specific literature were eliminated (e.g. “itinerary”, “day”, “time”, “go”). After cleaning the textual data, the “word frequency” function in NVivo12 was run to identify the 300 most frequently mentioned words.
Nouns and place names were then extracted from the list of those 300 most frequent words. Nouns were grouped into the 8 categories: “foods & cuisine”; “activities”; “transports & infrastructure”; “history & culture”; “natural landscape”; “local people”; “accommodation”; “shopping & services” as proposed by Murphy et al. (2000). Place names were grouped into “sub-destinations”. Each item was coded as a Node in NVivo 12 software. Statements describing Vietnam are coded into “Holistic image” node.
Manual coding process was conducted to identify descriptors (adjectives) that tourists associate to each node in above-mentioned categories and nodes. For example: in the statement “The food in Hanoi was fantastic”, fantastic is identified as descriptor of “foods & cuisine”; in “My impression about Hoi An is three words: charming, colorful and relaxing”, “charming”, “colorful” and “relaxing”are descriptors of Hoi An sub-destination; or in “I found Vietnam to be very friendly, colorful and interesting”; “friendly” and “colorful” and “interesting” are descriptors of “Vietnam holistic image”. Each descriptor is also coded as a node.
Query function of NVivo 12 permits to export the frequency of coded references in a node. Matrix coding function provides tabulation outputs showing cross relationship among nodes in term of frequency of coded items.
963. Results and discussions
In content analysis method, the frequency of occurrence of words indicates their importance. Their percentage analysis will allow us to have an overall view of the structure of the phenomenon to be studied. In this case, it is the structure of destination image. Next, we will analyze and discus some prominent findings.
3.1 Top attractions (sub-destinations in Vietnam)
The most frequent place names were counted and ranked in table 3. In this result, 7 out of 10 sub-destinations (Ha Noi, Hoi An, Hochiminh City (HCMC), Da Nang, Hue, Nha Trang, Sapa) are coincident with “Top 10 Destinations in Vietnam 2017” announced by TripAdvisor (https://www.tripadvisor.com/TravelersChoice-Destinations-cTop-g293921). The other 3 destinations (Phan Thiet, Da Lat and Phu Quoc) selected by TripAdvisor accordingly rank 11, 12, 13 in the finding of this research. Therefore, the data collected in this study has covered most of important sub-destinations in Vietnam. They are highly relevant and sufficiently representative for the whole Vietnam tourism image.
Tab. 3 – Top attractions in Vietnam
Source: Author’s own elaboration.
|
Rank |
Name |
Number references |
% |
Top attractions by TripAdvisor |
|
1 |
Hanoi |
368 |
23.25% |
Hanoi |
|
2 |
HCMC |
290 |
18.32% |
HoiAn |
|
3 |
HoiAn |
185 |
11.69% |
HCMC |
|
4 |
HaLong |
171 |
10.80% |
DaNang |
|
5 |
Sapa |
108 |
6.82% |
Hue |
|
6 |
Hue |
102 |
6.44% |
Nha Trang |
|
7 |
Danang |
98 |
6.19% |
Sapa |
|
8 |
Mekong |
80 |
5.05% |
PhanThiet |
| 97
9 |
NinhBinh |
42 |
2.65% |
Dalat |
|
10 |
Nhatrang |
31 |
1.96% |
Phu Quoc |
|
11 |
PhuQuoc |
29 |
1.83% |
|
|
12 |
Dalat |
28 |
1.77% |
|
|
13 |
PhanThiet |
27 |
1.71% |
|
|
14 |
PhongNha |
24 |
1.52% |
3.2 Attributes of destination image
3.2.1 Functional attributes of destination image
With respect to the first objective of this study, table 4 displays frequencies of key words mentioned in the corpus grouped in 8 dimensions representing key functional attributes of destination image.
Tab. 4. Dimensions and functional attributes of destination image of Vietnam.
|
Dimensions |
Key items |
% |
|
|
1 |
Foods & cuisine |
Food (665); Seafoods (46); Coffee (216); cuisine (30); fruit (78); Noodles (89); Pho (85); Rice (155); Soup (47); Vegies (53); Bun (48); Banhmi (62); Coconuts (48) |
17.55% |
|
2 |
Activities |
Cruising (231); Riding (255); Fishing (42); Kayak (80); Shows (171); Cooking class (39); Pubs (14); Swimming (72): Treks (55); Walking (191); Bars (44); Cafe shop (118); Clubs (29) |
12.62% |
|
3 |
Infrastructure and transportations |
Bus (259); Motorbike (236); Road (282); Scooters (98); Taxis (156); Traffic (153); Trains (213); Transport (58); Bridges (129); Buildings (135); skyscraper (17); City (195) |
12.34% |
| 98
4 |
History and Culture |
Citadel (43); Culture (81); Dragons (63); History (84); Lanterns (66); Mausoleum (46); Museum (182); Pagodas (76); Temples (174); Tunnels (126); War (220); Old-Quarter (136); Ancient- town (410); Village (246) |
9.42% |
|
5 |
Natural landscape |
Beach (289); Cave (186); Countryside (36); Dunes (17); Floating (92); Hills (43); Island (184); Landscapes (65); Limestones (61); Mountains (154); Nature (76); Paddy fields (72); Rice terraces (49); river (219); Sands (40); Scenery (52); Sight (111); Sunset (51) |
15.42% |
|
6 |
Local people |
Driver (260); Girls (107); Tour Guide (358); Locals (149); People (558); Staffs (117) |
16.17% |
|
7 |
Accommodation |
Hotels (808); Accommodations (88); Homestay (84); Hostel (93); Rooms (320) |
10.70% |
|
8 |
Shopping and Services |
Markets (371); Shops (302); Stall (95); Tailors (58); Tour agents (120); Handicraft (61); Mall (19); Spa (40) |
5.78% |
Source: Author’s own elaboration.
Results in the table 4 indicate the importance of dimensions of “Food and cuisine” (17.55%), “Local people” (16.17%), “Natural landscape” (15.42%) with highest frequency of coded items.
Key items in “food and cuisine” dimension are cooked food, local fruits and coffee. “Natural landscape” attributes are quite diversified including beach, limestone landscape, mountains, paddy fields/terraces and rivers characteristics. Key activities for tourists include water experience (cruising, swimming, fishing, kayak), nature discovery and eat & drink which rely mainly on two dominant dimensions of “Natural landscape” and “Food and cuisine”.
99Native residents and staff who provide tourism activities and services are two components in “Local people”, in which Vietnamese Girls in Ao Dai (Vietnamese traditional costume) is an attractive attribute to tourists.
Among attributes of “Infrastructure and transportations”, tourists are mainly concerned about the means of transport. Interestingly, motorbike and traffic are two impressive images. In history and culture, Vietnam war, daily life in ancient town of HoiAn, in old-quarter of Hanoi and in mountain village are most mentioned by tourists. “Accommodation” in Vietnam does not show any special feature or concern for tourist. Shopping at local markets/shops for local food, handmade products and tailored clothes are most favored in the “Shopping and Services”.
3.2.2 Functional attributes of destination image
perceived by group of tourists
In most destination image research, significant difference of image perception was found among tourists of different socio-demographic characteristics such as gender, age, education, income, occupation and marital status (Baloglu & McCleary, 1999; Beerli & Martin, 2004). A number of empirical works revealed that previous experiences with a destination were likely to influence the perceived destination image and future behaviour. A higher number of visits to a destination would result in more positive image of that destination as well as in higher interests and likelihood to revisit it (Chon, 1991; Echtner & Ritchie, 1993; Hu & Ritchie, 1993; Milman & Pizam, 1995). Table 5 shows how the structure of key dimensions change among tourists of different gender and times of visit to Vietnam.
Tab. 5 – Dimensions of destination image of Vietnam by group of tourists.
|
Dimensions |
Whole |
Female |
Male |
Repeated tourists |
First time tourists |
|
|
61.25% |
38.75% |
15% |
85% |
|||
|
1 |
Foods & cuisine |
17.55% |
19.20% |
14.94% |
24.55% |
16.31% |
|
2 |
Activities |
12.62% |
10.82% |
15.47% |
11.62% |
12.80% |
| 100
3 |
Infrastructure and transportations |
12.34% |
12.04% |
12.81% |
6.34% |
13.40% |
|
4 |
History and culture |
9.42% |
9.36% |
9.51% |
11.42% |
9.07% |
|
5 |
Natural landscape |
15.42% |
15.62% |
15.10% |
13.42% |
15.77% |
|
6 |
Local people |
16.17% |
14.44% |
18.90% |
18.17% |
15.82% |
|
7 |
Accommodation |
10.70% |
11.02% |
10.19% |
4.70% |
11.76% |
|
8 |
Shopping and Services |
5.78% |
7.50% |
3.06% |
9.78% |
5.07% |
|
100.00% |
100.00% |
100.00% |
100.00% |
100.00% |
Source: Author’s own elaboration
Firstly, female tourists mentioned more about “Food & Cuisine” and “Shopping & Services” compared to males. Inversely, male tourists pay more attention to “Activities” and “Local people” than females. This result is an endorsement of previous studies that female and male have relatively different interests regarding some of the destination attributes (Carr, 2001; Meng & Uysal, 2008). Between group of first time visit and repeated visits, “Food & Cuisine, Local people, Shopping & Services” are more mentioned by repeated tourists while “Accommodation, Infrastructure & Transportation” are less important to them. The perception of a destination image and tourist interest will be changed after the first visit (Baloglu & McCleary, 1999; Gartner, 1994). In fact, the quality of accommodation, infrastructure & transportation is an issue of Vietnam tourism. Therefore, these dimensions can be regarded as the risk factors to first time visitors. However, for repeated tourists, this result implies that risk and negative factors are not their top concerns.
3.3 Descriptors of destination image ’ s dimensions
A difference of this study from previous ones on Vietnam destination image is that the author explores more deeply the feelings and evaluations of tourists regarding Vietnam via the way they use descriptors 101(adjectives) in their post-trip-report. This also aim at creating a pool of destination image descriptors which are specific to Vietnam for further quantitative steps. By using matrix query function in Nvivo12, the top 10 most frequent descriptors of each dimension are shown in the table 6.
Unsurprisingly, all adjectives used to describe dimensions of “Food and cuisine”, “Local people”, “Natural landscape” and “History and culture” are positive. These findings are mostly congruent with previous studies on Vietnam destination image. Tran (2013) found that friendly people (73%), Good food (40%), Beautiful scenery (43%), Nice Beach and sea (27%), Natural landscapes (19%), Interesting culture (15%), history (12%), Crowed cities (12%), Cheap (11%) are answers for the question: “What is theimage or characteristic evoked when thinking of Vietnam as a tourism destination?”.
Inversely, many negative adjectives in trip reports are assigned to “Infrastructure and transportations”. These adjectives include “Bad”, “Old”, “Crazy”, “Chaotic”. This fact supports finding of Loi and Sentosa (2014) and Loi et al. (2014) that negative images of Vietnam are poor transportation and poor infrastructure. However, it is worth to mention that tourist show contrary feelings towards describing “Traffic” in Vietnam: “Crazy”, “Chaotic” but “Great”.
102Tab. 6 – Top 10 descriptors of Vietnam destination image’s dimensions.
|
Rank |
Dimensions |
|||||||||||||||
|
Foods & cuisine |
Activities |
Infrastructure and transportations |
History and culture |
Natural landscape |
Local people |
Accommodation |
Shopping and Services |
|||||||||
|
Descriptors |
Freq |
Descriptors |
Freq |
Descriptors |
Freq |
Descriptors |
Freq |
Descriptors |
Freq |
Descriptors |
Freq |
Descriptors |
Freq |
Descriptors |
Freq |
|
|
1 |
Delicious |
81 |
Great |
38 |
Old |
45 |
Old |
75 |
Beautiful |
58 |
Friendly |
47 |
Great |
51 |
Good |
21 |
|
2 |
Great |
78 |
Memorable |
23 |
Bad |
23 |
Ancient |
48 |
Great |
45 |
Great |
38 |
Nice |
36 |
Great |
17 |
|
3 |
Fresh |
56 |
Exciting |
23 |
Modern |
23 |
Charming |
24 |
Stunning |
30 |
Young |
37 |
Good |
27 |
Excellent |
12 |
|
4 |
Nice |
41 |
Relaxing |
19 |
Busy |
21 |
Beautiful |
19 |
Green |
26 |
Good |
27 |
Old |
27 |
Famous |
10 |
|
5 |
Good |
35 |
Enjoyable |
18 |
Crazy |
21 |
Impressive |
18 |
Incredible |
25 |
Lovely |
26 |
Lovely |
24 |
Friendly |
10 |
|
6 |
Amazing |
34 |
Nice |
17 |
Great |
18 |
Interesting |
17 |
Gorgeous |
22 |
Nice |
18 |
Beautiful |
22 |
Busy |
8 |
|
7 |
Cheap |
30 |
Traditional |
17 |
Ancient |
17 |
Fascinating |
16 |
Relaxing |
21 |
Amazing |
18 |
Cheap |
13 |
Expensive |
8 |
|
8 |
Traditional |
29 |
Unique |
16 |
Chaotic |
15 |
Traditional |
15 |
Amazing |
19 |
Wonderful |
14 |
Luxury |
10 |
Nice |
7 |
|
9 |
Special |
25 |
Amazing |
14 |
Cheap |
15 |
Great |
14 |
Breathtaking |
16 |
Beautiful |
14 |
Friendly |
10 |
Interesting |
7 |
|
10 |
Green |
25 |
Pleasant |
12 |
Good |
12 |
Unique |
13 |
Peaceful |
14 |
Helpful |
12 |
Amazing |
9 |
Cheap |
7 |
Source: Author’s own elaboration.
103Following the conceptualization of Hankinson (2004) introduced in table 1, all descriptors in table 6 are further classified into Functional, Symbolic and Experiential categories. Top 20 descriptors of each category are retained in the table 7. In which:
a. Functional descriptors: are those used to describe items of functional/tangible attributes: “foods & cuisine”; “transports & infrastructure”; “history and culture”; “natural landscape”; “accommodation”.
b. Symbolic descriptors: adjectives describe “Local People”, “Shopping & services”.
c. Experiential descriptors: adjectives relating activities; descriptors of the destination’s feel; the character of the built environment (e.g. historic, modern, green and spacious; descriptors related to security and safety (Hankinson, 2004).
Tab. 7 – Functional, Symbolic and Experiential descriptors.
|
Functional |
Experiential |
Symbolic |
|
|
1 |
Great |
Amazing |
Nice |
|
2 |
Old |
Busy |
Beautiful |
|
3 |
Good |
Incredible |
Friendly |
|
4 |
Delicious |
Interesting |
Lovely |
|
5 |
Ancient |
Exciting |
Young |
|
6 |
Cheap |
Memorable |
Charming |
|
7 |
Stunning |
Relaxing |
Crazy |
|
8 |
Traditional |
Enjoyable |
Gorgeous |
|
9 |
Special |
Impressive |
Unique |
|
10 |
Bad |
Breathtaking |
|
|
11 |
Modern |
Fascinating |
|
|
12 |
Excellent |
Chaotic |
|
|
13 |
Famous |
Peaceful |
|
|
14 |
Diverse |
Wonderful |
|
|
15 |
Perfect |
Pleasant |
|
| 104
16 |
Expensive |
Safe |
|
|
17 |
Contrast |
Comfortable |
|
|
18 |
Tasty |
Fantastic |
|
|
19 |
Warm |
Quiet |
|
|
20 |
Touristy |
Green |
Source: Author’s own elaboration.
Among descriptors found in table 7, “exciting”, “relaxing”, “pleasant” are the only adjectives proposed by Baloglu and Brinberg (1997) to measure the affective image of destination. This finding supports the criticism of Kim and Perdue (2011) and Kneesel et al. (2010) about the imperfection of this affective image measurement scale of Russell and Pratt (1980).
These experiential and symbolic descriptors can be used at initial pool of affective image attributes. However, they need to be validated by academics and professionals with relevant knowledge and experience in the area of tourism as suggested by Hardesty and Bearden (2004).
3.4 Holistic descriptors of Vietnam Destination
According to Echtner and Ritchie (1993), people have images of both individual attributes (scenery, climate, price) and holistic impressions of a destination. Beside descriptors on each dimension, in this study, we found that tourists also use descriptors of Vietnam as a whole. There are 29 out of 80 tourists who give their feelings and evaluations on Vietnam holistically. Table 8 provides top 20 descriptors which tourists used to describe Vietnam as a whole as well as their overall experience/feelings during the trip in Vietnam, ranked in descending order according to their frequency. The overall perception on Vietnam was positively evaluated with the following descriptors: beautiful, great, good, cheap, amazing, old, safe, diverse, friendly, incredible, etc. Unfortunately, although the slogan of Vietnam tourism is “Vietnam: timeless charm”, the descriptor “charming” is ranked 17th. This indicates that the promotional message was not perceived as a strong attribute in tourists mind.
105Tab. 8 – Top holistic descriptors of Vietnam destination.
|
Descriptors |
Freq |
Descriptors |
Freq |
||
|
1 |
Beautiful |
23 |
11 |
Wonderful |
11 |
|
2 |
Great |
23 |
12 |
Fascinating |
11 |
|
3 |
Good |
21 |
13 |
Perfect |
10 |
|
4 |
Cheap |
19 |
14 |
Fresh |
9 |
|
5 |
Amazing |
17 |
15 |
Happy |
9 |
|
6 |
Safe |
14 |
16 |
Nice |
9 |
|
7 |
Diverse |
13 |
17 |
Charming |
9 |
|
8 |
Friendly |
13 |
18 |
Comfortable |
8 |
|
9 |
Incredible |
13 |
19 |
Crazy |
7 |
|
10 |
Traditional |
13 |
20 |
Delicious |
7 |
Source: Author’s own elaboration.
It is worth to mention that in table 8, there are 7 functional descriptors coming from table 7. This means that tourists equally use functional descriptors to describe Vietnam as a whole beside experiential and symbolic ones. Based on Echtner and Ritchie’s approach (Etcher and Richier, 1991), these descriptors can be called Functional-holistic attributes. Therefore, more precisely, pool of symbolic and experiential descriptors should be referred to as psychological holistic attributes.
Conclusion
The study has several important implications in theory, methodology and practice. However, it presents some limitations, which provide opportunities for further research. We discuss these implications and limits in this conclusion.
106Theoretical implications
By deeply examining the tourist’s post-trip-reports with content analysis techniques, the study has penetrated into the perceived image of tourists on Vietnam destination. Destination image was accepted in the literature as a multi-dimensional, multi-faced construct with different ways of conceptualization. Although at an exploratory level, this study provides some important theoretical implications.
First, it suggests that descriptors of salient functional attributes should be considered as items in measurement scale of cognitive perception (in attitude theory approach). By this way, cognitive image will become exactly the functional holistic component in human information processing theory approach.
Second, the measurement scale of affective response proposed by Baloglu and Brinberg (1997) could be improved by adding relevant experiential and symbolic descriptors which similarly become psychological holistic component in human information processing theory approach.
Accordingly, components of destination image can be conceptualized as illustrated in Figure 3.

Fig. 3 – Conceptualization of destination image components.
Source: Author’s own elaboration.
Third, the study has identified all the components and attributes pool (as conceptualization in figure 3) for Vietnam destination image. However, before proceeding towards further quantitative measurements, these attributes and descriptors need to be refined and validated by academics and professionals with relevant knowledge and experience in the area of tourism.
Methodological implications
This study revealed the overall perception as well as the structure of Vietnam destination image by analyzing post-trip-reports collected in the virtual space of Internet. Despite its exploratory status, in term of research methodology, this qualitative study confirms that content analysis of UGCs is an effective approach for destination image study in particular and tourism research in general. Even with only 80 trip reports, the final result is very comprehensive and consistent with previous studies.
Practical implications
The research has helped to identify the positive and negative attributes of Vietnam’s image in the mind of international tourist. Positive attributes are cooked food, local fruits, coffee, beach, limestone landscape, mountains, paddy fields/terrace, rivers, water experience, nature discovery and eat & drink, local people, Vietnamese Girls, Vietnam war, ancient town of Hoi An, in old-quarter of Hanoi and in mountain villagelocal markets/shops for local food, handmade products and tailored clothes. Negative images are mainly infrastructure and transportation. However, motorbike and traffic are perceived as both positive and negative attributes. These positive attributes need to be promoted more widely. Vietnam tourism can use food, friendly people and natural landscape as competitive identities in branding strategy.
Overall perception on Vietnam is positively evaluated with following descriptors: beautiful, great, good, cheap, amazing, old, safe, diverse, friendly, incredible, etc., However, it differs from the image conveyed by the Government in the slogan “Vietnam: timeless charm”. It means that the current promotional slogan is not congruent with the attributes perceived by tourists.
108Descriptors that tourists assigned to Vietnam that were found in this study can be used as keywords for tourism marketers of Vietnam in composing marketing messages.
With the importance of user generated content, it is suggested that, DMOs nowadays must actively participate in tourism forums/social network platforms in order to capture the feedback of tourists and provide timely response to their comments.
Limitations
First, the study has limited the analysis of textual data to post-trip reports in English language which doesn’t reflect the diversity of tourists in Vietnam. Future research might include post-trip reports in other languages like Chinese and French, as well as in form of photos and videos. Therefore, findings from this study cannot be generalized to other non-English speaking markets. Second, content analysis is exploratory and is based on subjective judgments to some extent. Further research will have to focus on these issues and to validate the results using quantitative techniques.
109References
Aaker D. A. & Joachimsthaler E. (2000), Brand Leadership, New York, The Free Press.
Abdul Rashid, R., & Ismail H. N. (2008), “Critical analysis on destination image literature: Roles and purposes”, 2d International Conference “Built Environment in Developing Countries 2008”, Penang, Malaysia, 3-4 December.
Bagozzi R. P. (1978), “The construct validity of the affective, behavioral, and cognitive components of attitude by analysis of covariance structures”, Multivariate Behavioral Research, vol. 13, no1, p. 9-31.
Baloglu S. & Brinberg D. (1997), “Affective images of tourism destinations”, Journal of travel research, vol. 35, no4, p. 11-15.
Baloglu S., Henthorne T. L. & Sahin S. (2014), “Destination image and brand personality of Jamaica: A model of tourist behavior”, Journal of travel & tourism marketing, vol. 31, no8, p. 1057-1070.
Baloglu S. & McCleary K. W. (1999), “A model of destination image formation”, Annals of tourism research, vol. 26, no4, p. 868-897.
Baloglu S., & Love C. (2005), “Association meeting planners’ perceptions and intentions for five major US convention cities: the structured and unstructured images”, Tourism Management, vol. 26, no5, p. 743-752.
Beerli A. & Martin J. D. (2004a), “Factors influencing destination image”, Annals of tourism research, vol. 31, no3, p. 657-681.
Beerli A. & Martin J. D. (2004b), “Tourists’ characteristics and the perceived image of tourist destinations: a quantitative analysis—a case study of Lanzarote, Spain”, Tourism Management, vol. 25, no5, p. 623-636.
Bigne J. E., Sanchez M. I. and Sanchez J. (2001), “Tourism image, evaluation variables and after purchase behaviour: inter-relationship”, Tourism management, vol. 22, no6, p. 607-616.
Breckler S. J. (1984), “Empirical validation of affect, behavior, and cognition as distinct components of attitude”, Journal of personality and social psychology, vol. 47, no6, p. 1191-1205.
Bruwer J. & Lesschaeve I. (2012), “Wine tourists’ destination region brand image perception and antecedents: conceptualization of a winescape framework”, Journal of Travel & Tourism Marketing, vol. 29, no7, p. 611-62.
Bui T. L. H. (2011), “Congruency between the projected and perceived tourism destination image of Vietnam”, Journal of International Business Research, vol. 10, no2, p. 1-13.
110Carr N. (2001), “An exploratory study of gendered differences in young tourists perception of danger within London”, Tourism Management, vol. 22, no5, p. 565-570.
Castro C. B., Armario E. M. & Ruiz D. M. (2007), “The influence of market heterogeneity on the relationship between a destination’s image and tourists’ future behaviour”, Tourism Management, vol. 28, no1, p. 175-187.
Chen C. C. & Lin Y. H. (2012), “Segmenting mainland Chinese tourists to Taiwan by destination familiarity: A factor-cluster approach”, International Journal of Tourism Research, vol. 14, no4, p. 339-352.
Choi S. Lehto X. Y. & Morrison A. M. (2007), “Destination image representation on the web: Content analysis of Macau travel related websites”, Tourism Management, vol. 28, no1, p. 118-129.
Chon K.-S. (1990), “The role of destination image in tourism: A review and discussion”, The Tourist Review, vol. 45, no2, p. 2-9.
Chon K.-S. (1991), “Tourism destination image modification process: Marketing implications”, Tourism Management, vol. 12, no1, p. 68-72.
Gunn C. (1972), Vacationscape, Bureau of Business Research, University of Texas, Austin, TX, US.
Cooper M. (2009), “Vietnam’s Image as a Tourism Destination in Japan: an Analysis of Japanese Travel Guidebooks and Brochures, and Attribute Importance-Performance”, Ritsumeikan Journal of Asia Pacific Studies, vol. 25, no1, p. 37-54.
Crompton J. L. (1979), “An assessment of the image of Mexico as a vacation destination and the influence of geographical location upon that image”, Journal of travel research, vol. 17, no4, p. 18-23.
Dann G. M. (1996), “Tourists’ images of a destination-an alternative analysis”, Journal of Travel & Tourism Marketing, vol. 5, no1-2, p. 41-55.
Echtner C. M. & Ritchie J. B. (1991), “The meaning and measurement of destination image”, Journal of tourism studies, vol. 2, no2, p. 2-12.
Echtner C. M. & Ritchie J. B. (1993), “The measurement of destination image: An empirical assessment”, Journal of travel research, vol. 31, no4, p. 3-13.
Echtner C. M., & Ritchie J. R. (2003), “The meaning and measurement of destination image”, Journal of tourism studies, vol 14, no1, p. 37-48 .
Elliot S., Papadopoulos N. & Kim S. S. (2011), “An integrative model of place image exploring relationships between destination, product, and country images”, Journal of travel research, vol. 50, no5, p. 520-534.
Fotis J., Buhalis D. & Rossides N. (2012), “Social media use and impact during the holiday travel planning process”, in Fuchs M., Ricci F., Cantoni L. (eds), Information and Communication Technologies in Tourism 2012, Vienna, Springer, p. 13-24.
111Gallarza M.G., Gil Saura I. & Calderon Garc í a H. (2002), “Destination image: Towards a conceptual framework”, Annals of tourism research, vol. 29 no1, p. 56-78.
Gartner W. C. (1994), “Image formation process”, Journal of travel & tourism marketing, vol. 2, no2-3, p. 191-216.
Gnoth J. (2002), “Leveraging export brands through a tourism destination brand”, Journal of Brand Management, vol. 9, no4, p. 262-280.
Goodal B. & Ashworth G. (2013), Marketing in the Tourism Industry (RLE Tourism): The promotion of destination regions, London, Routledge.
Hankinson G. (2004), “Relational network brands: Towards a conceptual model of place brands”, Journal of vacation marketing, vol. 10, no2, p. 109-121.
Hardesty D. M. & Bearden W. O. (2004), “The use of expert judges in scale development: Implications for improving face validity of measures of unobservable constructs”, Journal of business research, vol. 57, no2, p. 98-107.
Hanzaee K. H. & Saeedi H. (2011), “A model of destination branding for Isfahan city: Integrating the concepts of the branding and destination image”, Interdisciplinary Journal of Research in Business, vol. 1, no4, p. 12-28
Hosany S. & Ekinci Y. (2003), “An application of the brand personality scale into tourist destinations: Can destinations be branded”, “34th annual Travel and Tourism Research Association Conference”, June 15-18, St. Louis, Missouri.
Hosany S., Ekinci Y. & Uysal M. (2006), “Destination image and destination personality: An application of branding theories to tourism places”, Journal of business research, vol. 59, no5, p. 638-642.
Hu Y. & Ritchie J. B. (1993), “Measuring destination attractiveness: A contextual approach”, Journal of travel research, vol. 32, no2, p. 25-34.
Hughes H. L. (2008), “Visitor and non-visitor destination images: The influence of political instability in South-Eastern Europe”, Turizam: međunarodni znanstveno-stručni časopis, vol. 56, no1, p. 59-74.
Hunt J. D. (1971), “Image: A Factor in Tourism”, Ph.D. dissertation, Colorado State University, USA.
Hunt J.D. (1975), “Image as a factor in tourism development”, Journal of Travel Research, vol. 13, no 3, p. 1-7.
Jenes B. (2012), “Theoretical and practical issues in measuring country image dimensions and measurement model of country image and country brand”, PhD Thesis, Doctoral School of Business Administration, Corvinus University of Budapest, Hungary.
Jenkins O. H. (1999), “Understanding and measuring tourist destination images”, The International Journal of Tourism Research, vol. 1, no1, p. 1-15.
Khuong M. N. & Ha H. T. T. (2014), “The Influences of Push and Pull Factors on the International Leisure Tourists’ Return Intention to Ho Chi 112Minh City, Vietnam–A Mediation Analysis of Destination Satisfaction”, International Journal of Trade, Economics and Finance, vol. 5, no6, p. 490-496.
Khuong M. N. & Nguyen P. A. (2017), “Factors Affecting Tourist Destination Satisfaction and Return Intention—A Study in Ho Chi Minh City, Vietnam”, Journal of Economics, Business and Management, Vol. 5, no. 2, p. 95-102.
Kim D. & Perdue R. R. (2011), “The influence of image on destination attractiveness”, Journal of travel & tourism marketing, vol. 28, no3, p. 225-239.
Kim S. E., Lee K. Y., Shin S. I. & Yang, S. B. (2017), “Effects of tourism information quality in social media on destination image formation: The case of Sina Weibo”, Information & Management, vol. 54, no6, p. 687-702.
Kneesel E., Baloglu S. & Millar M. (2010), “Gaming destination images: Implications for branding”, Journal of travel research, vol. 49, no1, p. 68-78.
Kotler P., Haider D. H. & Rein I. (1993), Marketing places: attracting investment, industry, and tourism to cities, states, and nations, New York, The Free Press.
Kumar V. (2016), “Examining the role of destination personality and self-congruity in predicting tourist behavior”, Tourism Management Perspectives, vol. 20, p. 217-227.
Kumar V. & Nayak J. (2014), “The measurement & conceptualization of destination personality”, Tourism Management Perspectives, vol. 12 (October), p. 88-93.
Larmolenko S. & Schneider P. (2010), “Destination Image Representation Online: Content Analysis of Ukraine Travel Related Websites”, “Travel and Tourism Research Association Conference”, Honolulu, Hawaii, USA | 21-24 June.
Lawson F. & Baud-Bovy M. (1977), Tourism and recreation development, London, Architectural Press.
Lacy S., Riffe D., Thorson E. & Duffy M. (2009), “Examining the features, policies and resources of citizen journalism: Citizen news sites and blogs”, Web Journal of Mass Communication Research, vol. 15, no1, p. 1-20.
Litvin S. W., Goldsmith R. E., & Pan B. (2008), “Electronic word-of-mouth in hospitality and tourism management”, Tourism Management, vol. 29, no3, p. 458-468.
Loi D. H. & Sentosa I. (2014), “The image of Vietnam as a tourism destination for Malaysian tourists”, International Journal of Business and Management, vol. 10, no1, p. 258-265.
Loi D. H., Sentosa I. & Gin L. J. (2014), “Development of Framework for the Image of Vietnam as a Tourism Desination for Malaysian Tourists”, Researchers World, vol. 5, no4, p. 15-24.
113MacKay K. J. & Fesenmaier D. R. (2000), “An exploration of cross-cultural destination image assessment”, Journal of Travel Research, vol. 38, no4, p. 417-423.
Maher A. A. & Carter L. L. (2011), “The affective and cognitive components of country image: Perceptions of American products in Kuwait”, International Marketing Review, vol. 28, no6, p. 559-580.
Matlovicova K. & Kolesarova J. (2012), “Destination image and possibilities of its formation: a case study of the image of Thailand as a tourist destination perceived by Slovaks”, Central European Regional Policy and Human Geography, vol. 2, no1, p. 5-20.
Mayo E. (1973), “Regional images and regional travel behavior”, in “The Travel Research Association Fourth Annual Conference Proceedings”, Sun Valley, Idaho, USA, August 12.
Meng F. & Uysal M. (2008), “Effects of gender differences on perceptions of destination attributes, motivations, and travel values: An examination of a nature-based resort destination”, Journal of Sustainable Tourism, vol. 16, no4, p. 445-466.
Milma A. & Pizam A. (1995), “The role of awareness and familiarity with a destination: The central Florida case”, Journal of travel research, vol. 33, no3, p. 21-27.
Murphy P., Pritchard M. P. & Smith, B (2000), “The destination product and its impact on traveller perceptions”, Tourism Management, vol. 21, no1, p. 43-52.
Nael C. M., Quester P. G. & Hawkin D. (1999), Consumer Behavior: Implications for marketing strategy, Sydney, McGraw-Hill.
Nadeau J., Heslop L., O ’ Reilly N. & Luk P. (2008), “Destination in a country image context”, Annals of tourism research, vol. 35, no1, p. 84-106.
Naidoo P., Ramseook-Munhurrun P. & Durbarry R. (2012), “The brand image of a small island destination”, Tourismos: An International Multidisciplinary Journal of Tourism, vol. 7, no2, p. 261-278.
Neuendorf K. A. (2002), The content analysis guidebook, Thousand Oaks, CA: Sage
Nghiêm-Phú B. (2014), “A review of destination image studies from 2008 to 2012”, European Journal of Tourism Research, vol. 8, no1, p. 35-65.
Orth U. R. & De Marchi R. (2007), “Understanding the relationships between functional, symbolic, and experiential brand beliefs, product experiential attributes, and product schema: advertising-trial interactions revisited”, Journal of Marketing Theory and Practice, vol. 15, no3, p. 219-233.
Prayag G. (2010), “Brand image assessment: international visitors’ perceptions of Cape Town”, Marketing Intelligence & Planning, vol. 28, no4, p. 462-485.
114Pike S. (2002), “Destination image analysis – a review of 142 papers from 1973 to 2000”, Tourism Management, vol. 23, no5, p. 541-549.
Poiesz T. B. (1989), “The image concept: Its place in consumer psychology”, Journal of Economic Psychology, vol. 10, no4, p. 457-472.
Prebežac D. & Mikulić J. (2008), “Destination image and key drivers of perceived destination attractiveness”, Market-Tržište, vol. 20, no2, p. 63-178.
Qu H., Kim L. H. & Im H. H. (2011), “A model of destination branding: Integrating the concepts of the branding and destination image”, Tourism management, vol. 32, no3, p. 465-476.
Ráthonyi G. (2013), “Influence of social media on tourism–especially among students of the University of Debrecen”, Applied Studies in Agribusiness and Commerce, vol. 7, no1, p. 105-112.
Reilly M. D. (1990), “Free elicitation of descriptive adjectives for tourism image assessment” , Journal of travel research, vol. 28, no4, p. 21-26.
Riffe D., Lacy S. & Fico, F. G. (2005), Analyzing media messages: Using quantitative content analysis in research, 2d ed, Mahwah, NJ: Lawrence Erlbaum Associates, Inc.
Russell J. A., & Pratt G. (1980), “A description of the affective quality attributed to environments”, Journal of personality and social psychology, vol. 38,no2, p. 311-322.
San Martín H., & Del Bosque I. A. R. (2008), “Exploring the cognitive–affective nature of destination image and the role of psychological factors in its formation”, Tourism management, vol. 29, no2, p. 263-277.
Sandes F. S. & Urdan A. T. (2013), “Electronic word-of-mouth impacts on consumer behavior: Exploratory and experimental studies”, Journal of International Consumer Marketing, vol. 25, no3, p. 181-197.
Saraniemi S. (2010), “Destination brand identity development and value system”, Tourism Review, vol, 65, no2, p. 52-60.
Stepchenkova S., & Morrison A. M. (2008), “Russia’s destination image among American pleasure travelers: Revisiting Echtner and Ritchie”, Tourism management , vol. 29, no3, p. 548-560.
Stepchenkova S. & Mills J. E. (2010), “Destination image: A meta-analysis of 2000–2007 research”, Journal of Hospitality Marketing & Management, vol. 19, no6, p. 575-60.
Stepchenkova S., & Li X. (2012), “Chinese outbound tourists’ destination image of America”, Journal of Travel Research, vol. 51, no6, p. 687-703.
Stephens Balakrishnan M., Nekhili R. & Lewis C. (2011), “Destination brand components”, International Journal of Culture, Tourism and Hospitality Research, vol. 5, no1, p. 4-25.
Tasci A. D. (2009), “A semantic analysis of destination image terminology”, Tourism Review International, vol. 13, no1, p. 65-78.
115Tasci A. D., Gartner W. C. & Tamer Cavusgil S. (2007), “Conceptualization and operationalization of destination image”, Journal of Hospitality & Tourism Research, vol. 31, no2, p. 194-223.
Tosun C., Dedeoğlu B. B. & Fyall A. (2015), “Destination service quality, affective image and revisit intention: The moderating role of past experience”, Journal of Destination Marketing & Management, vol. 4, no4, p. 222-234.
Tran L. (2013), “Measuring the perceived destination image of Vietnam in Finland”, Master’s thesis, University of Lapland, Finland.
Tran V. T., Do H. H., Phan N. V. N., Nguyen T. N., & Van Trang N. (2017), “An impact of social media and online travel information search in Vietnam”, Global Review of Research in Tourism, Hospitality and Leisure Management, vol. 3, no1, p. 71-92.
Truong T. H. & King B. (2009), “An evaluation of satisfaction levels among Chinese tourists in Vietnam”, International Journal of Tourism Research, vol. 11, no6, p. 521-535.
VNAT (2017), Viet Nam Tourism Annual Report 2016, Viet Nam National Administration of Tourism, October.
WTTC (2018), “The economic impact of global travel & tourism, Vietnam 2018” report of World Travel and Tourism Council.
Zhou L. (2005), “Destination attributes that attract international tourists to Cape Town” , Doctoral dissertation, University of the Western Cape, South Africa.
1 Email: van_ha.luong@edu.escpeurope.eu